CTA ridership data suggests TOD zones around transit should be much larger than the current half-mile maximum
Transit Oriented Development laws allow development projects near transit to forgo some of the car-oriented development restrictions they would otherwise be subject to. These policies, including Chicago’s eTOD ordinance, are driven by a simple idea – people living near transit is desirable and drives equitability, higher ridership, better land use, and improved sustainability.
Research supports the idea that population density and transit use are tightly linked. The US cities with the highest transit modal share are New York, San Francisco, Washington D.C., Boston, and Chicago, and it’s no coincidence that these cities are #1, #2, #7, #3 and #5 in population density, respectively.
A natural question that arises is what should be considered “near transit”? Chicago’s original TOD ordinance from 2013 was limited to buildings within 600 feet of most rail transit stops, later getting expanded to 0.25 miles in 2015 and 0.5 miles with last year’s Connected Communities Ordinance. (The ordinance also significantly expanded the number of TOD-eligible bus route corridors, nearly tripling the number of eligible properties.) In these areas of proximity, parking mandates are reduced or can be eliminated, and more pedestrian-friendly design standards are required. Additionally, new driveways and curb cuts require an additional layer of administrative review.
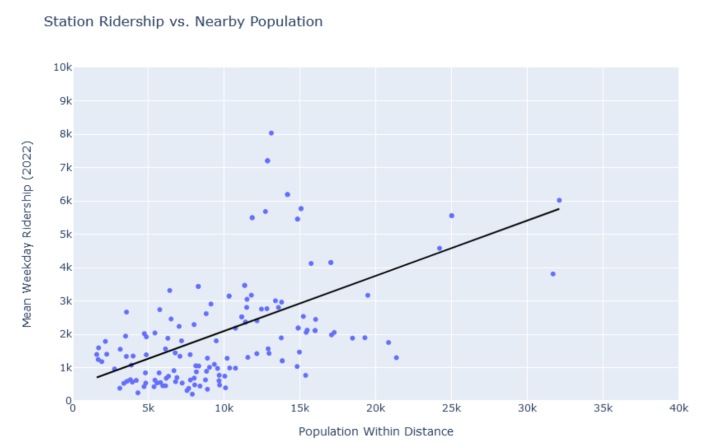
Population within 0.5 miles of CTA train stops certainly shows a correlation with ridership, so the ordinance as it stands makes sense and will likely help boost transit ridership as more developments come to fruition.
However, my analysis shows that the correlation between ridership and nearby population is strongest with a radius between 1-1.5 miles, much larger than the distances Chicago considers “transit-oriented.” Given the vocal opposition that many NIMBY groups present to eTOD projects, it’s likely that smaller than ideal TOD zones have been proposed for political expediency and to avoid challenging the status quo of low-density development by law.
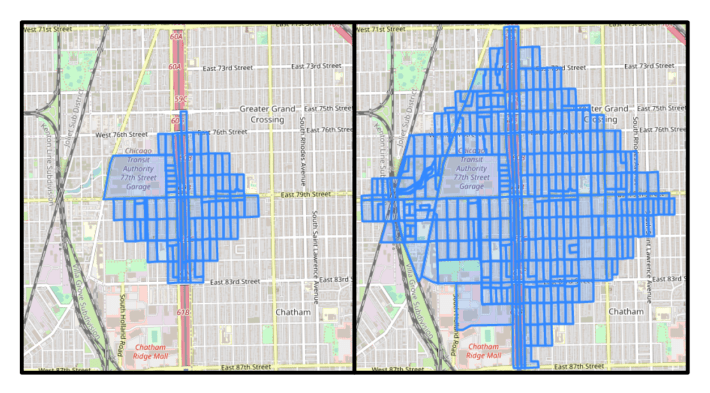
My analysis uses CTA-provided ridership data and block-level 2020 US Census data to find the population within an estimated grid walking distance of each “L” station. For example, if we look at the 79th Street Red Line station, we can calculate the population within a half mile to be 3,843, and the population within a mile to be 16,976. The question is: which of these areas should be considered the “service area” of that station for the purposes of development?
The total population living in a given area for each train station can be compared to the station’s ridership to assess what area best describes where people are actually traveling from to ride transit. There are limitations to this approach, since not all ridership is driven by residential density, and stops like airports, park and ride-heavy end-of-line stops and non-operational stops have been excluded from the analysis to try and account for this effect. However, we can still get a much better idea of how surrounding land use and transit ridership are linked than we could by just guessing.
Streetsblog Chicago has created an interactive scatter plot that shows each station, its ridership, and the population in a user-selected distance from the station – view it here. Explore how different distances show stronger or weaker correlation with ridership. By using the slider in the interactive plot to change the distance, you can see how the correlation between “nearby” population and mean weekday ridership strengthens or weakens.
For each chosen TOD distance a best-fit trendline is shown for ridership versus nearby population, and the trendline shows the R² value, which is a measure of how much of the variation in ridership is accounted for by population. An R² value of 1 would mean 100 percent of the variation is accounted for, indicating a perfect linear relationship whereas an R² value of 0 would mean 0% is accounted for, meaning there is no correlation at all. With the current 0.5 mile distance, only about 27 percent of the ridership variability is accounted for, increasing it to a distance of 1 mile increases this to 53 percent, indicating that population within a mile correlates much better with station ridership than population within half a mile. Too large of a distance weakens the relationship as well, since people tend to not travel two or three miles to get to a train station.
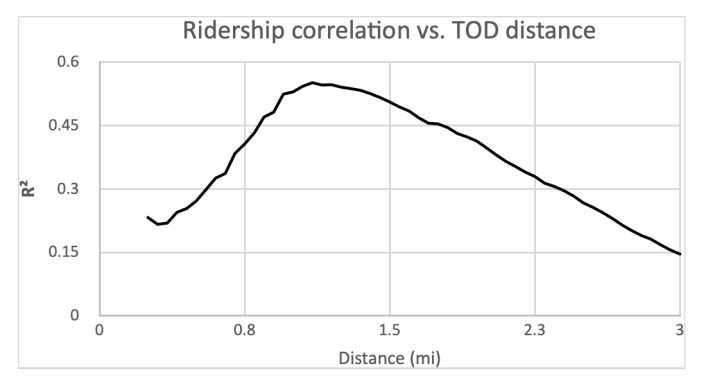
What this analysis shows is that the relationship between ridership and nearby population is strongest when we define “nearby” as being between 1.0 and 1.5 miles, not the 0.5 we currently define it as. Expanding TOD once again would result in much more of the city being covered under this ordinance. But policies like abandoning parking minimums and allowing “by-right” development (with no need for a zoning change) of 2-4 unit housing have already seen citywide adoption in some cities like Minneapolis, Portland, Buffalo, and Austin.
Chicago is also larger, denser, and has better transit capacity to serve developments with robust density and minimal or no parking than these cities. Another TOD expansion makes sense given the data, and should better position the city to meet its goals in terms of equality, sustainability, affordability, and fiscal stability.
Let us know in the comments section what you think of this analysis and Chicago’s current eTOD ordinance.
View our interactive scatter plot of Station Ridership vs. Nearby Population here.

Dd you appreciate this post? Please consider making a tax-deductible donation.
Streetsblog has migrated to a new comment system. New commenters can register directly in the comments section of any article. Returning commenters: your previous comments and display name have been preserved, but you'll need to reclaim your account by clicking "Forgot your password?" on the sign-in form, entering your email, and following the verification link to set a new password — this is required because passwords could not be carried over during the migration. For questions, contact tips@streetsblog.org.