New ridership numbers for the Chicago Transit Authority's 'L' stations show some interesting changes over the past 17 years. The increases in ridership at some stations have been obvious, but the decreases at other stations are a little surprising.
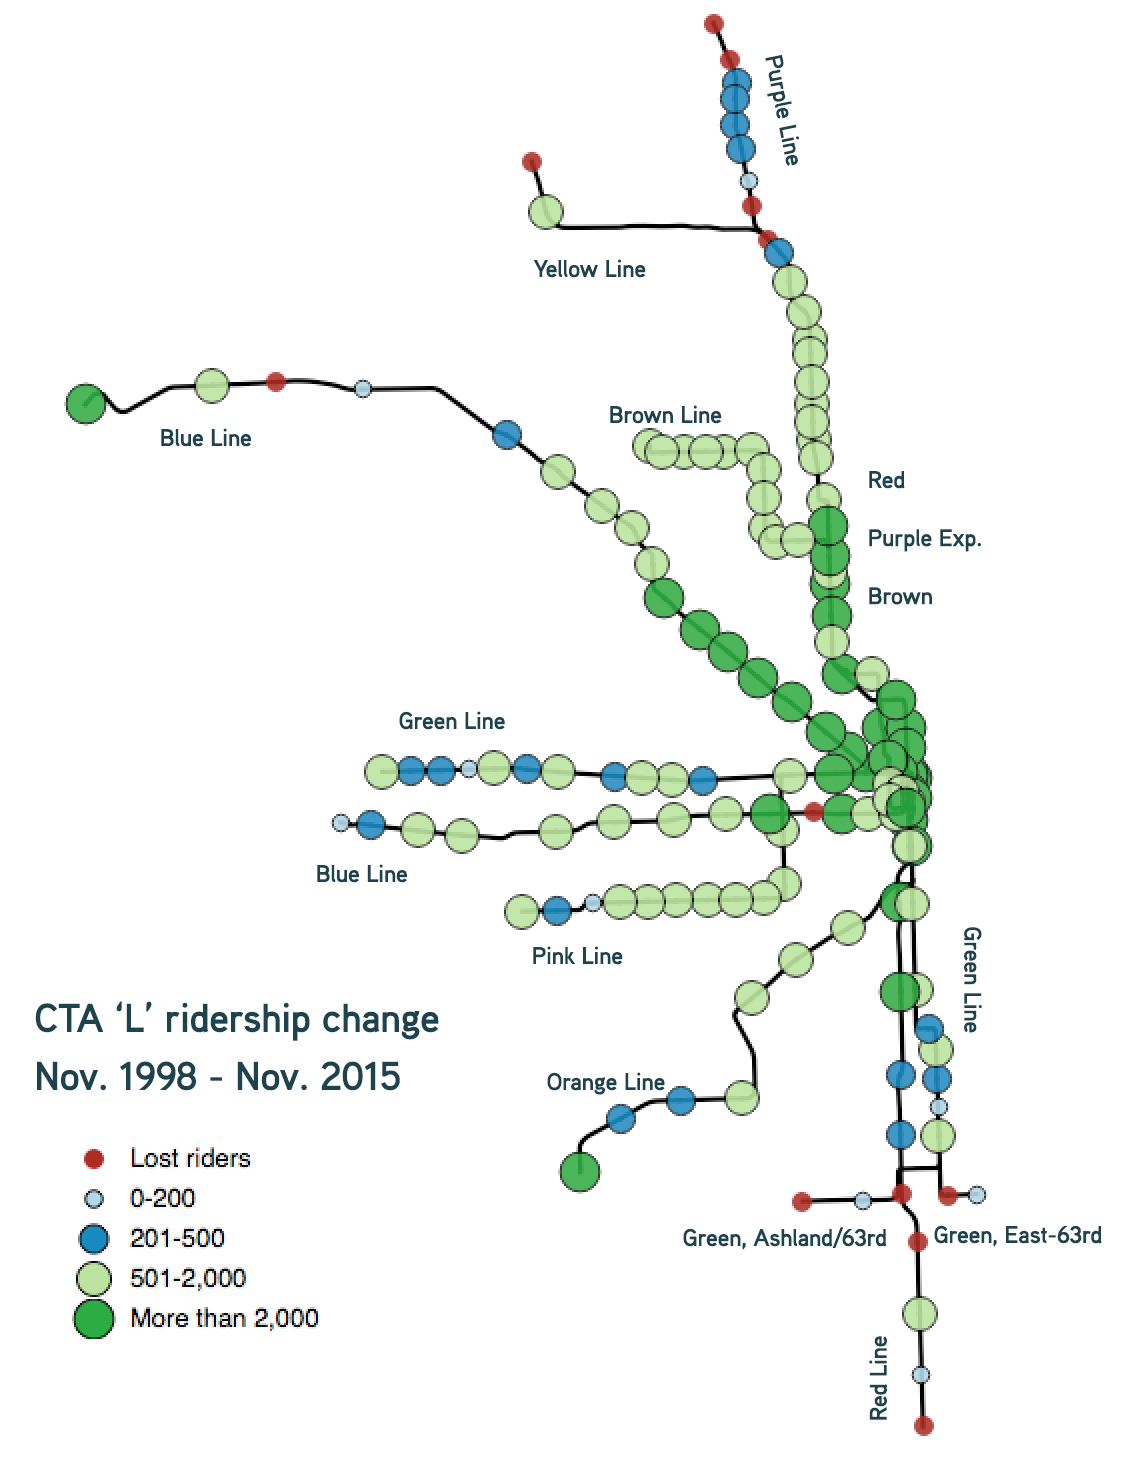
Last year the CTA's 'L' had its highest-ever total recorded ridership. From November 1998 to November 2015, the earliest and latest years for which complete weekday ridership data is available on the Regional Transit Authority's Mapping and Statistics data warehouse, known as RTAMS, 'L' ridership increased by 43 percent.
Sixty-eight of the 145 CTA stops saw an increase in ridership between 1998 and 2015, and 12 stations saw a drop in ridership. The latter included five Red and Green Line stations on Chicago's South Side, including the Red Line's 95th/Dan Ryan stop; the Blue Line's Racine station by UIC and Cumberland stop on the Northwest Side; plus suburban Yellow and Purple Line stations in Skokie, Evanston, and Wilmette.
Nearly all downtown stations have gained more than 2,000 riders per day since 1998, which can largely be credited to the recent development boom – only LaSalle/Van Buren lost riders, at seven percent. The Blue Line stations south of Belmont saw similar increases. Most Green Line stations on the Lake Street branch to Oak Park saw increases of more than 200 riders per day.
The 95th/Dan Ryan Red Line station has seen a 14 percent drop in riders since 1998, or about 2,700 fewer people per day. Despite that, it's still the ninth busiest station in the system. The stop is currently undergoing a $280 million renovation, which will make it easier and quicker to make transfers between the train and the many CTA and Pace bus routes that serve the station. That, and the more pleasant station environment, will likely boost ridership.
The Green and Pink Line's Morgan station, which opened in 2013 in the burgeoning Fulton Market District, already has nearly as many riders as the nearby Grand/Milwaukee Blue Line stop. That station reopened in 1999 after being closed for many years. It currently ranks 88th out of the 145 stations for ridership, and Morgan ranks 90th.
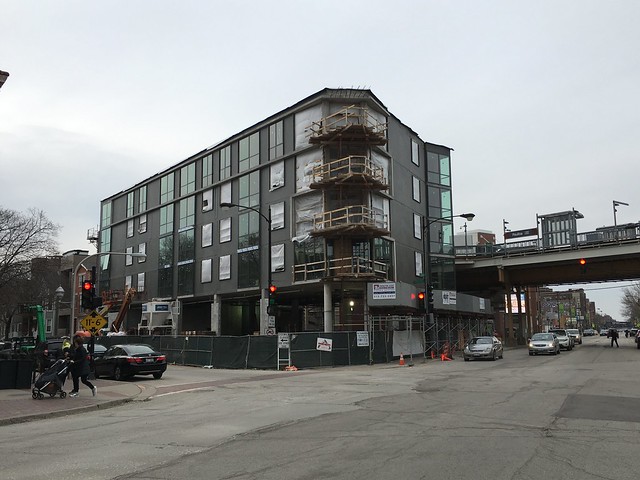
The Paulina Brown Line station has seen a 66 percent increase since 1998. The Center for Neighborhood Technology published a study last year showing an 11-percent increase in population within a half mile of the stop from 2000 to 2011. A new TOD building with 36 units, currently under construction next door, will definitely help ridership.
Interestingly, while the Blue Line's Racine station has lost 31 percent of its ridership since 1998, the nearby UIC-Halsted stop saw a 69-percent increase during the same period. Although the station is bounded by the Eisenhower Expressway and UIC campus to the south, and the Circle Interchange to the east, there has been plenty of residential development north of the station, and the number of UIC students is growing.
Two Purple Line station in Evanston – South Boulevard and Central – have lost riders since 1998, and the Main stop increased by only one percent. The city of Evanston grew by about 1,040 people between 2000 and 2014, and many new housing units were built downtown. Davis, the closest station to their city center, grew by eight percent.
Losses on the Green Line's East 63rd and Ashland/63rd branches aren't surprising, considering the significant amount of housing demolitions and population exodus that took place in Englewood and Woodlawn during the last decade.
While the 'L' system as a whole has been gaining ridership over the past two decades, the region hasn't seen an equal amount of development and job creation near all of the stations, and that's reflected in these ridership numbers.