On Monday Streetsblog's Igor Studenkov discussed how the CTA quietly made deep cuts to scheduled Blue Line service at the start of February. That has improved the percentage of scheduled service delivered (POSSD) numbers, but riders are still dealing with long waits between trains and crowded railcars due to far fewer runs.
However the latest scorecard for the CTA's "Meeting the Moment" pandemic recovery plan, released last week, reports that systemwide bus and train reliability improved in January. The agency badly needed a win, since POSSD figures actually got worse in December compared to November 2022, a slump the CTA blamed on the December 22-23 polar vortex, as well as unusually high absenteeism on New Year's Eve.
Judging from reports on Twitter, service was also terrible last Sunday during the Superbowl, presumably due to unplanned absences, which won't help February numbers.
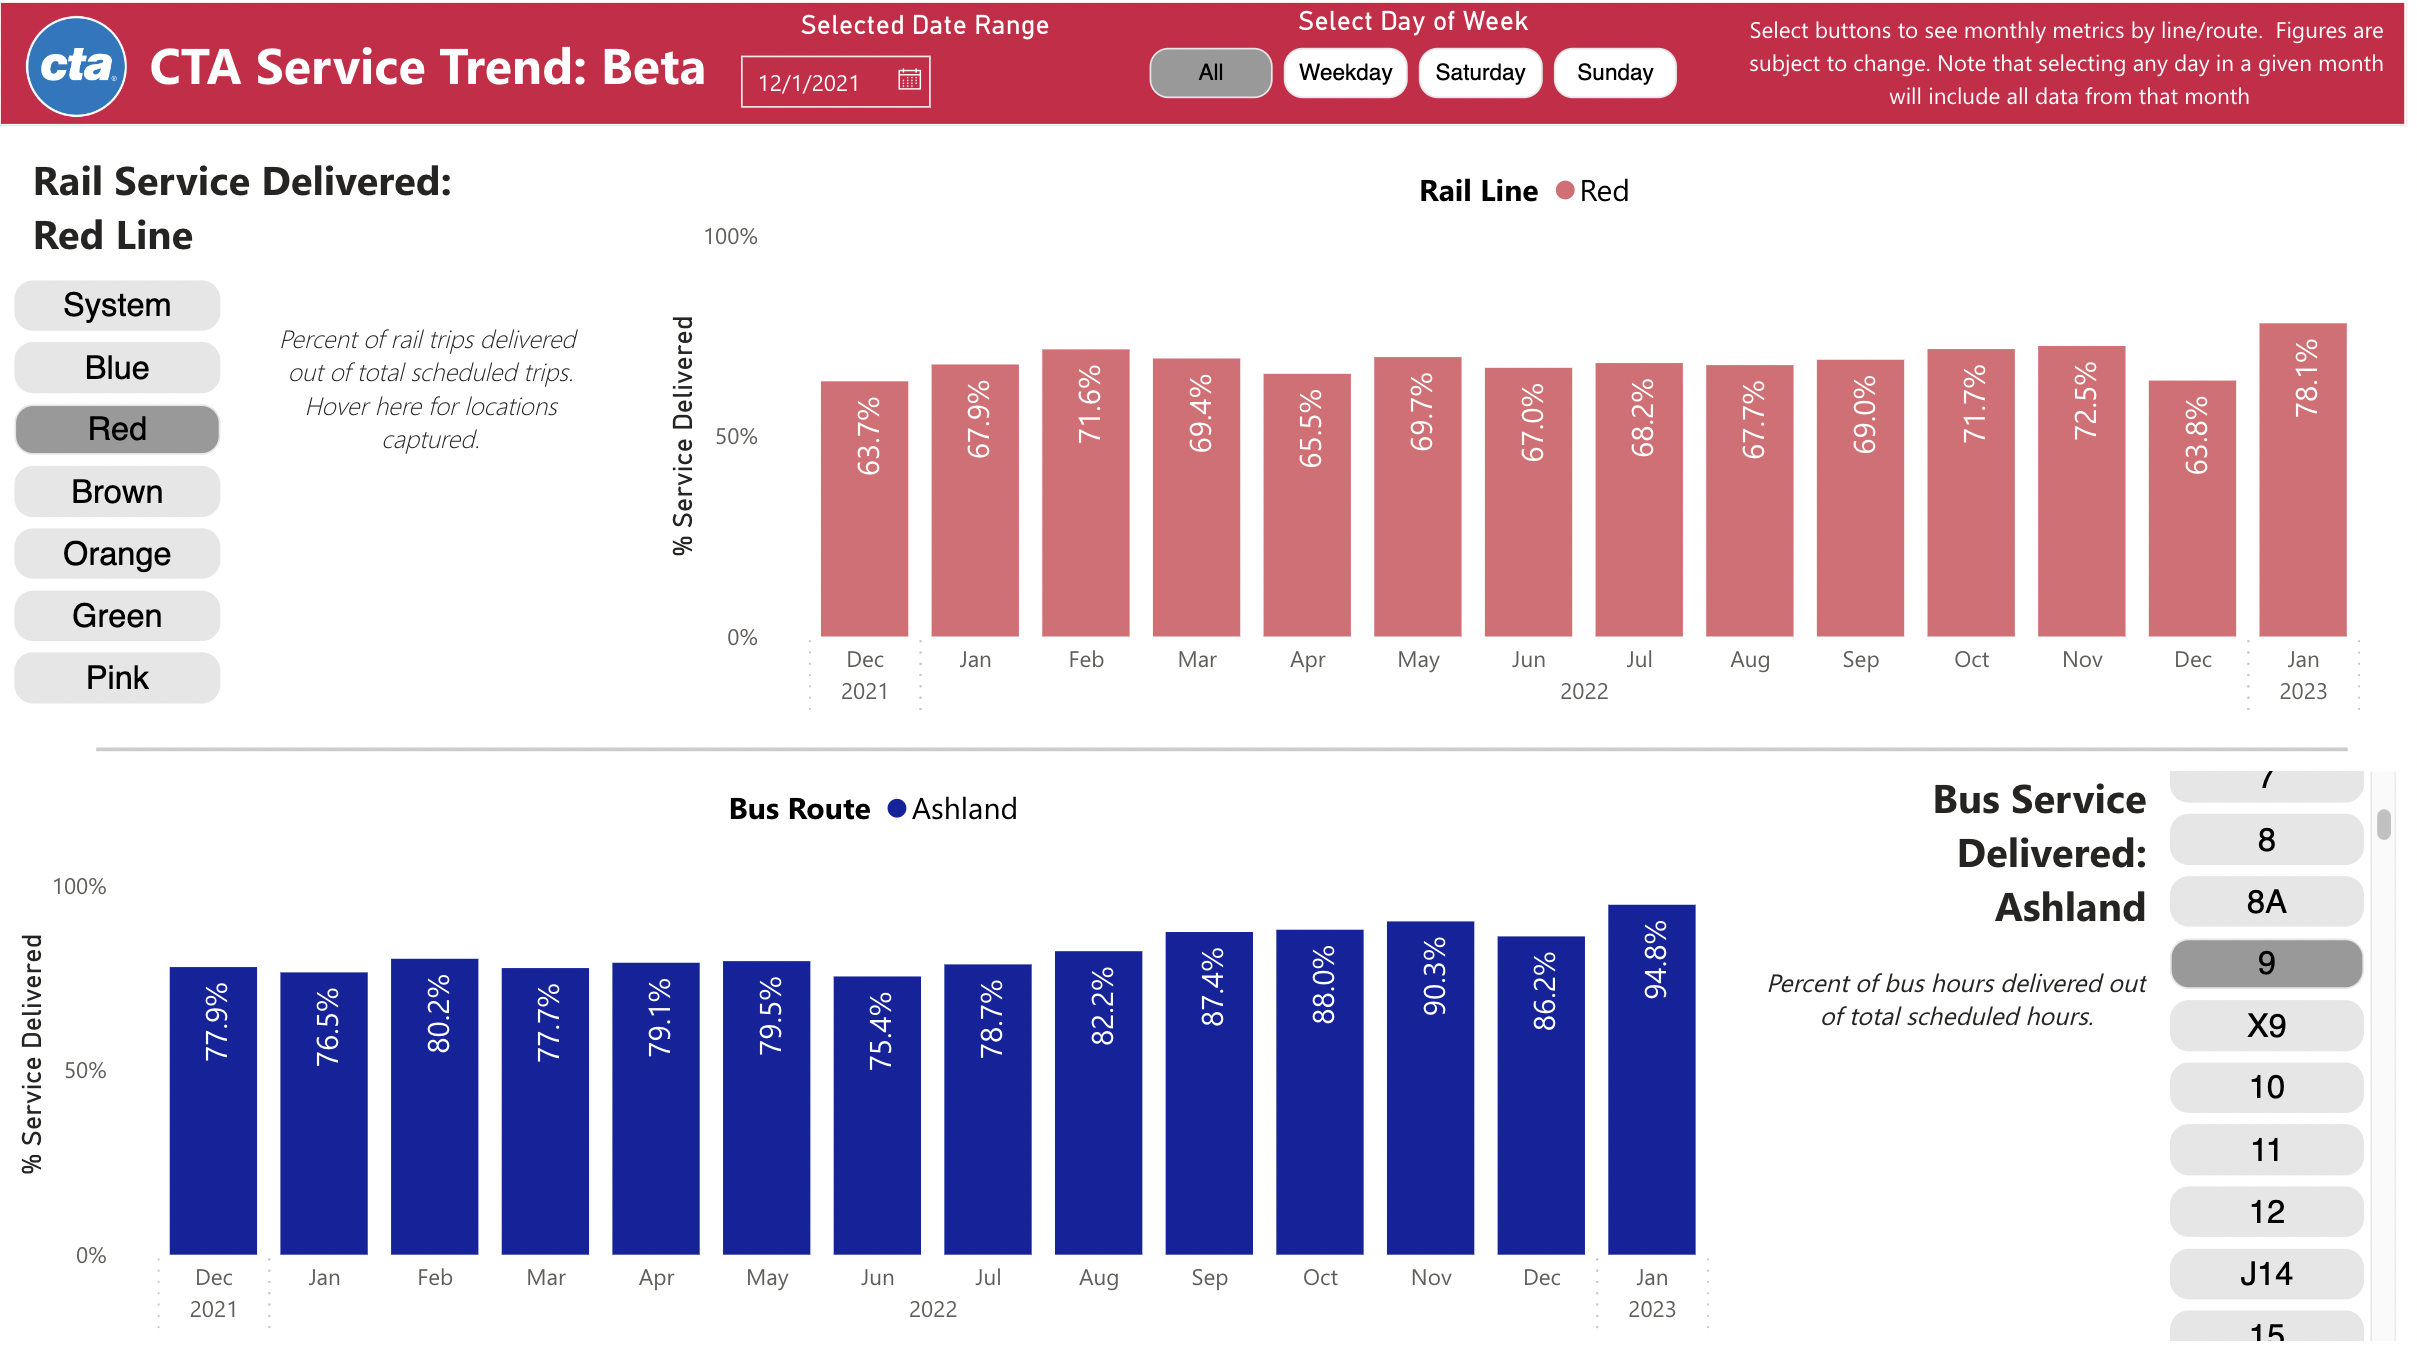
The January scorecard includes new interactive features, which allow riders to drill down into the data to see the percentage of scheduled service delivered numbers for any 'L' or bus line.
According to the transit agency, in January long wait times for trains – gaps that are double or triple the scheduled waits between runs – fell for the fifth straight month. Triple headways fell to an average of 14 incidents each weekday, down from 29. And double headways dropped to an average of 96 incidents each weekday, down from 158.
The CTA also says POSSD improved between December and January. Again the poor reliability in December set a low bar. 92.7 percent of scheduled bus runs were delivered in January compared to 83.4 percent in December. And 80.6 percent of scheduled 'L' runs materialized in January compared to only 75.4 percent in December.
The transit agency boasted that the Orange, Green, Brown, and Pink lines delivered about 90 percent their weekday scheduled service in January, which was made easier after scheduled service was cut last fall to better reflect available current staffing levels. However, the Red Line only provided 71.5 percent of scheduled runs last month, while the Blue Line delivered a mere 66.8 percent of scheduled trains.
The CTA rightly noted that the system's reduced schedules and reliability problems are due to worker shortages that are currently affecting almost all U.S. transit systems. The agency noted that it has offered financial incentives to retain and recruit workers and has held frequent job fairs, with an event in January drawing over 500 potential applicants. Recent rail operator classes have had full enrollment.
However, the agency said the the system is still currently short about 100 train drivers and 500 bus operators. The goal is to hire 700 bus drivers in 2023, with 88 hired in January.
Ald. Daniel LaSpata (1st), an outspoken sustainable transportation advocate, noted in his newsletter that the CTA's report of more than 90 percent of scheduled bus service delivered is good news, and the Fullerton, California, Western, and Ashland route, which serve his Near Northwest Side ward have been performing relatively well. "The bad news is that the Blue Line continues to have the worst percentage of scheduled service delivered (67.1 percent for weekdays against 78.9 percent systemwide) and the Milwaukee Ave bus is not providing the reliable alternative you need, with only 81.8 percent of scheduled service delivered. Please know that your frustration is my frustration."
Active Transportation Alliance director of planning David Powe applauded the improved numbers. "But there’s still much that must be done to build back public support and serve the needs of Chicago residents who rely on CTA. To get riders back and attract new riders, we need realistic schedules, reliable service, and bus-only lanes to prevent buses from getting stuck in traffic."
The grassroots transit advocacy group Commuters Take Action, which is often critical of CTA management, praised the new interactive features on the scorecard as a step in the right direction. "The increased detail of data in regards to service delivered on both bus and rail lines is a welcome step towards more transparency. Riders can now see the history of service on a route-by-route basis," said cofounder Fabio Göttlicher.
He also praised the bus service delivered improvement from 83 percent to 93 percent as "commendable," but noted that this is largely due to cuts in scheduled service. "CTA's new bus schedule overall cut service by 10 percent, with many busy routes seeing cuts of about 20 percent."
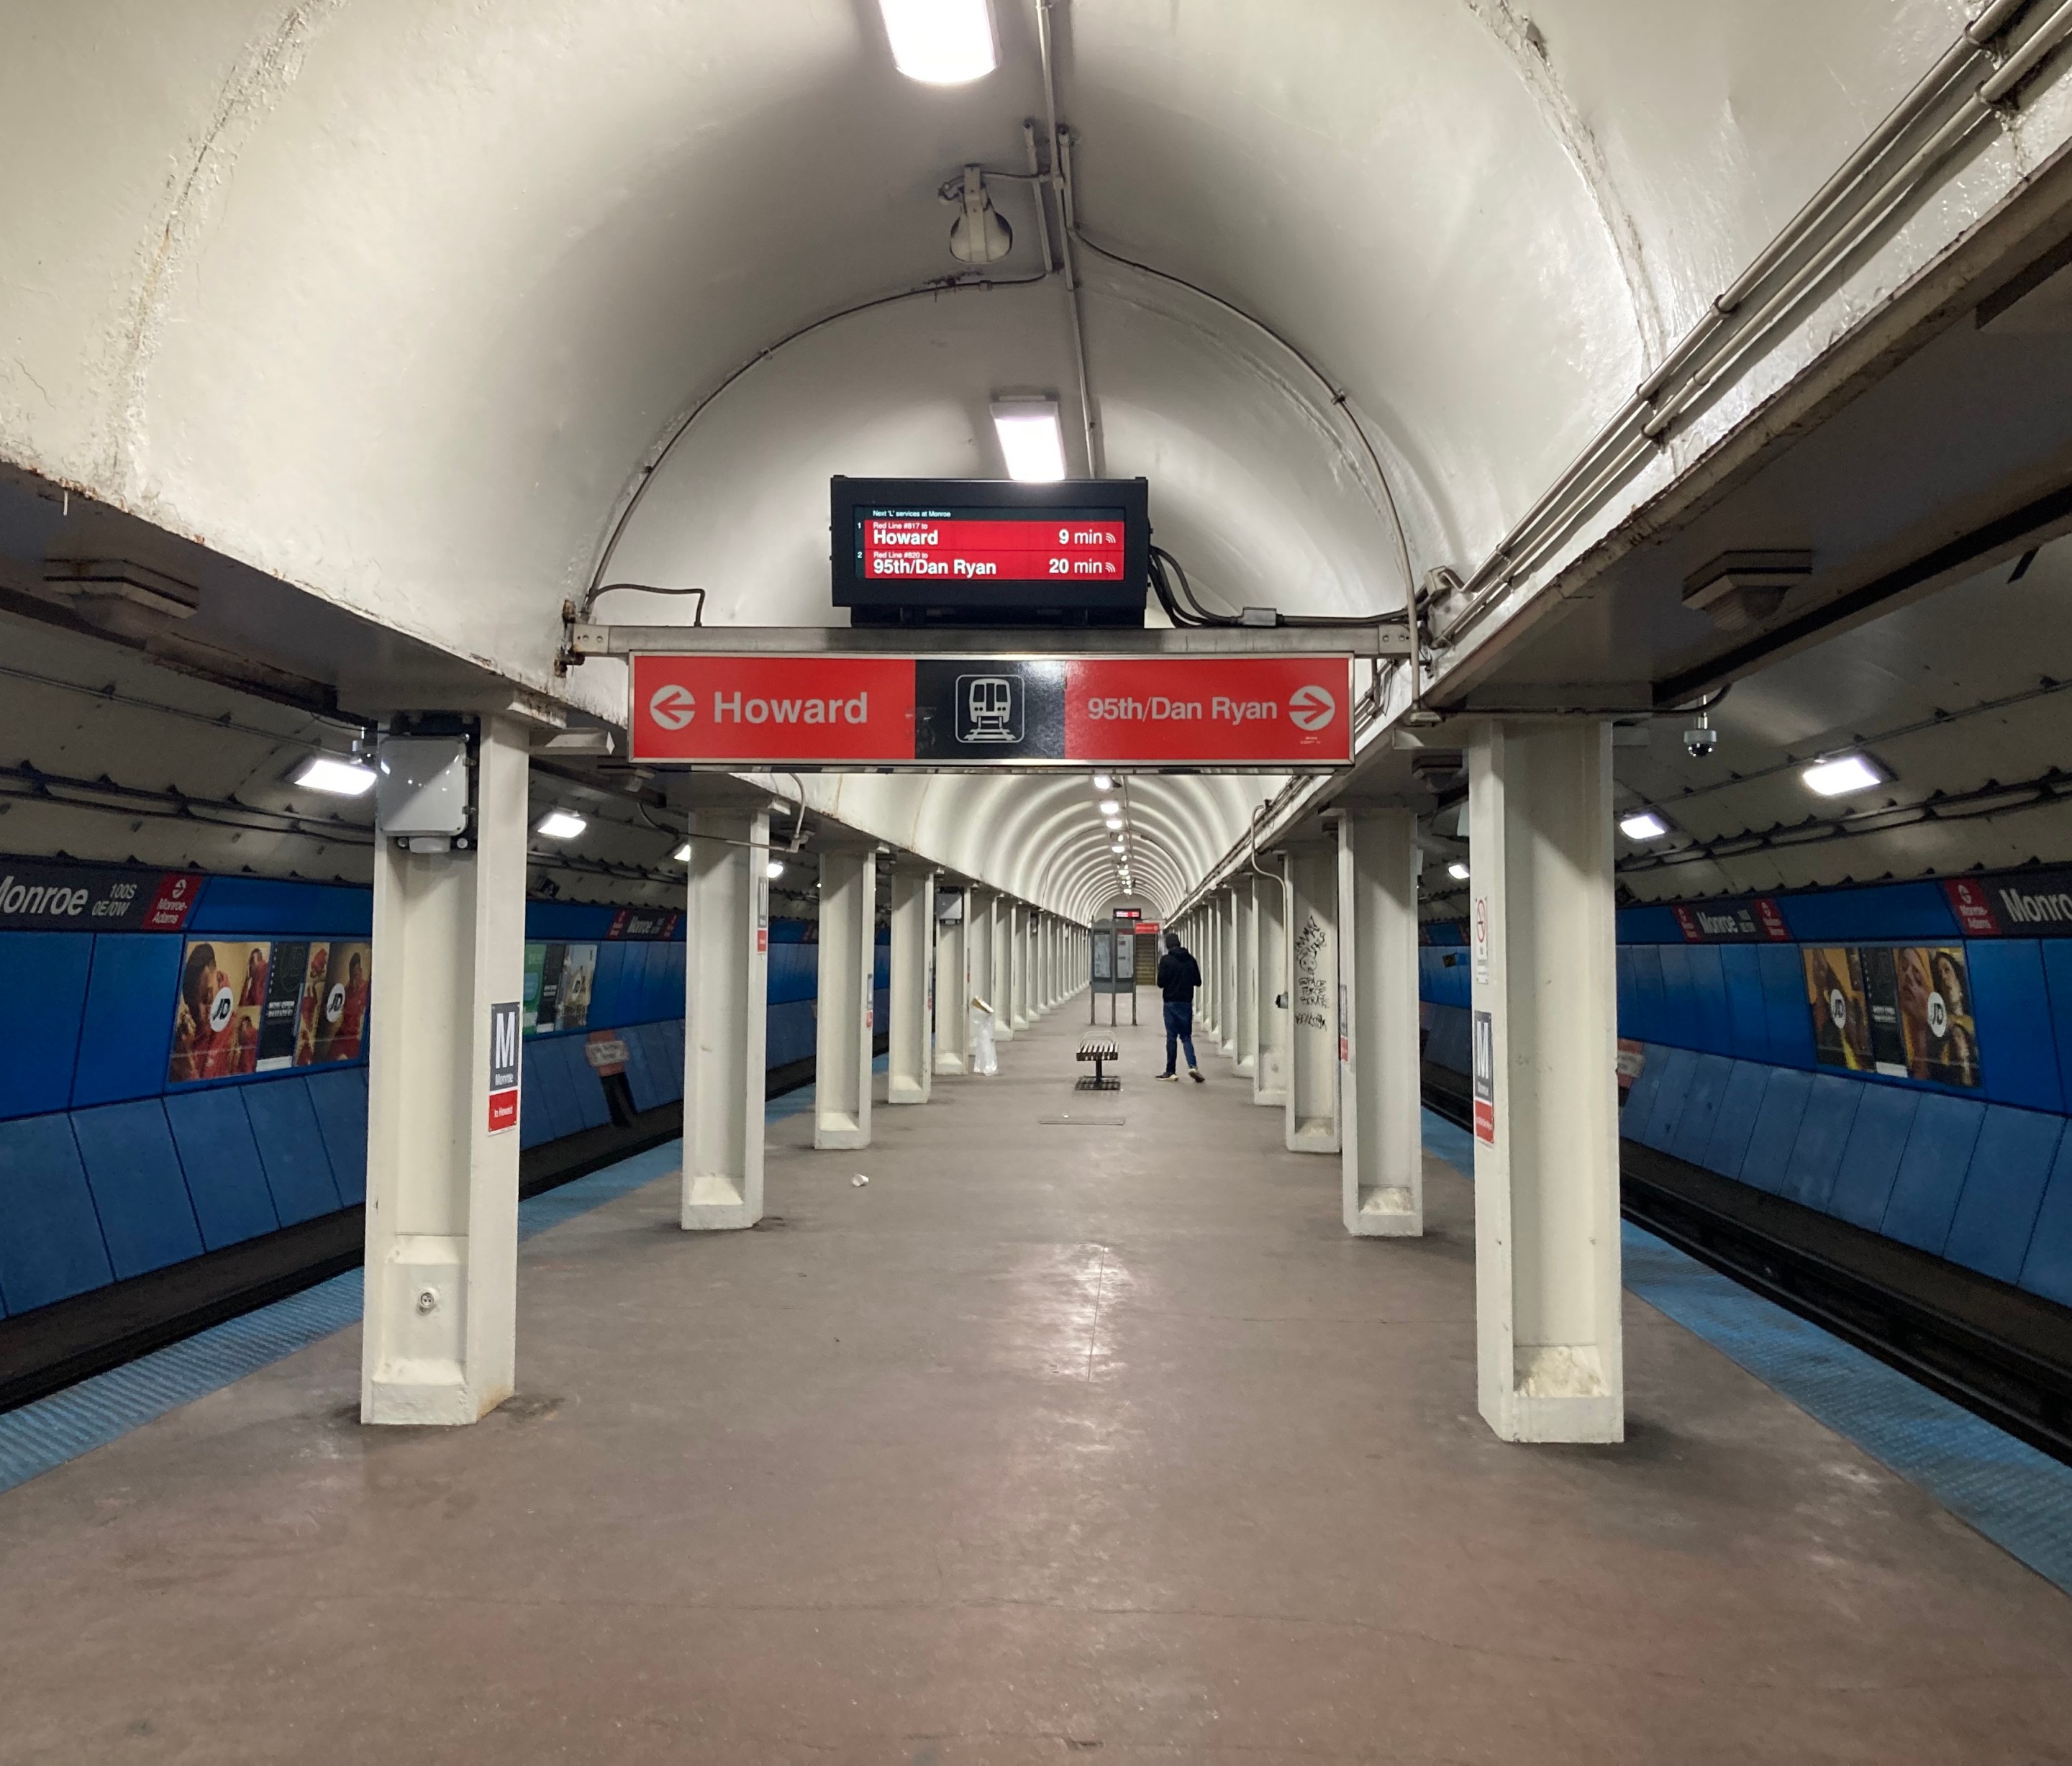
7:30 this morning, Western Forrest-Park blue line platform completely full, trains every 12 minutes AND Ventra app was down 🫠 @ctaaction @cta pic.twitter.com/3wKALquaDY
— Spacey KC (@HeyKaitHeyy) February 15, 2023
Göttlicher was also critical of the agency's lack of transparency on the February Blue Line service cuts. "We continue to receive daily reports of overcrowding on the blue line from our riders. We welcome a more realistic schedule, but we are disappointed by CTA's absolute lack of efforts to communicate this change. Lastly, we'd like to see a plan to return the blue line to full service by the CTA."
As for hiring, he gave a thumbs-up to the CTA's 2023 hiring goal of 700 bus drivers. However, he argued, "What's still missing from the scorecard is a glimpse into net operator gains/losses, i.e. attrition. Additionally, rail operator hiring updates are still missing from the presented statistics."
So the consensus among advocates seems to be that while the January report has some encouraging numbers, there's still a lot more the CTA could be doing to improve performance and communications with customers.

Did you appreciate this article? Please consider making a tax-deductible donation to help fund Streetsblog Chicago's next year of publication. Thanks!