Commuters Take Action maps just how deep cuts in scheduled CTA service have been
Update 2/9/23, 12:30 AM: Since the publication of this article, CTA announced additional cuts to scheduled Blue Line service at the February CTA board meeting. Total scheduled Blue Line service is now down 39 percent compared to the old schedules, bringing the average reduction in scheduled rail service to 17 percent. The Commuters Take Action map has been updated with this new information.
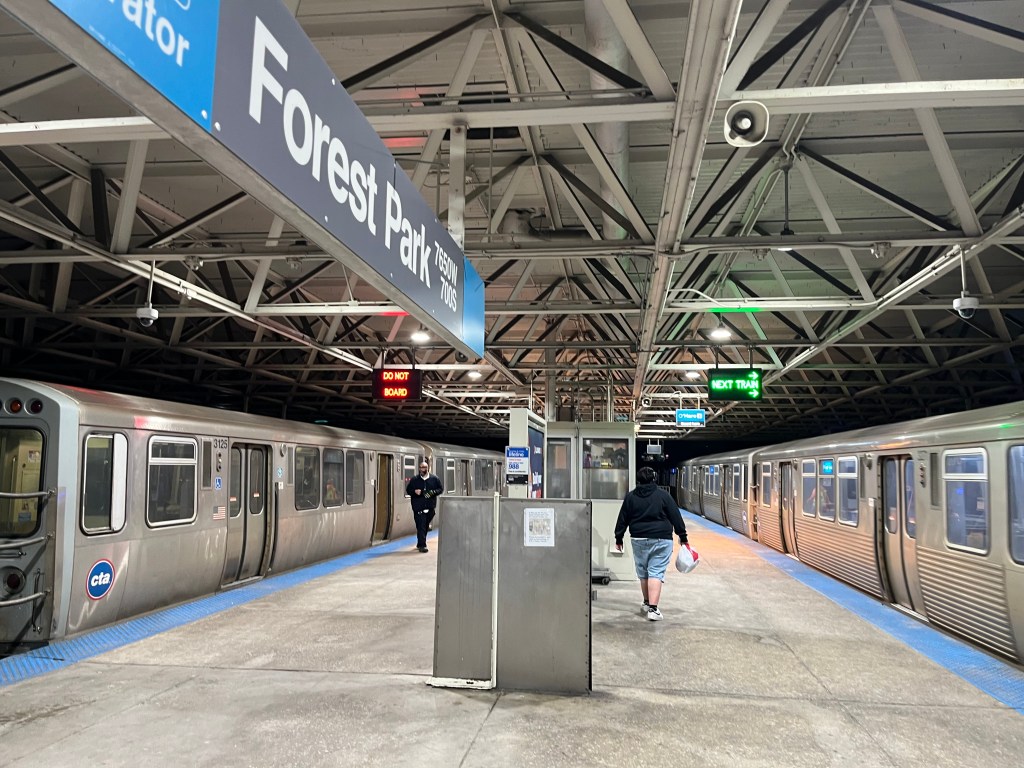
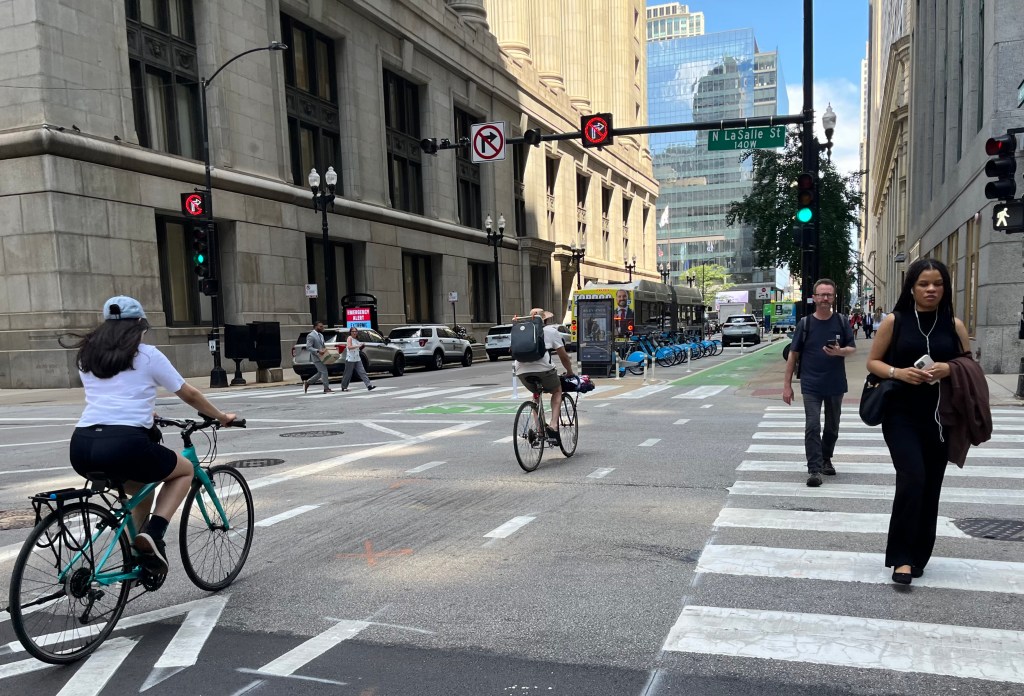
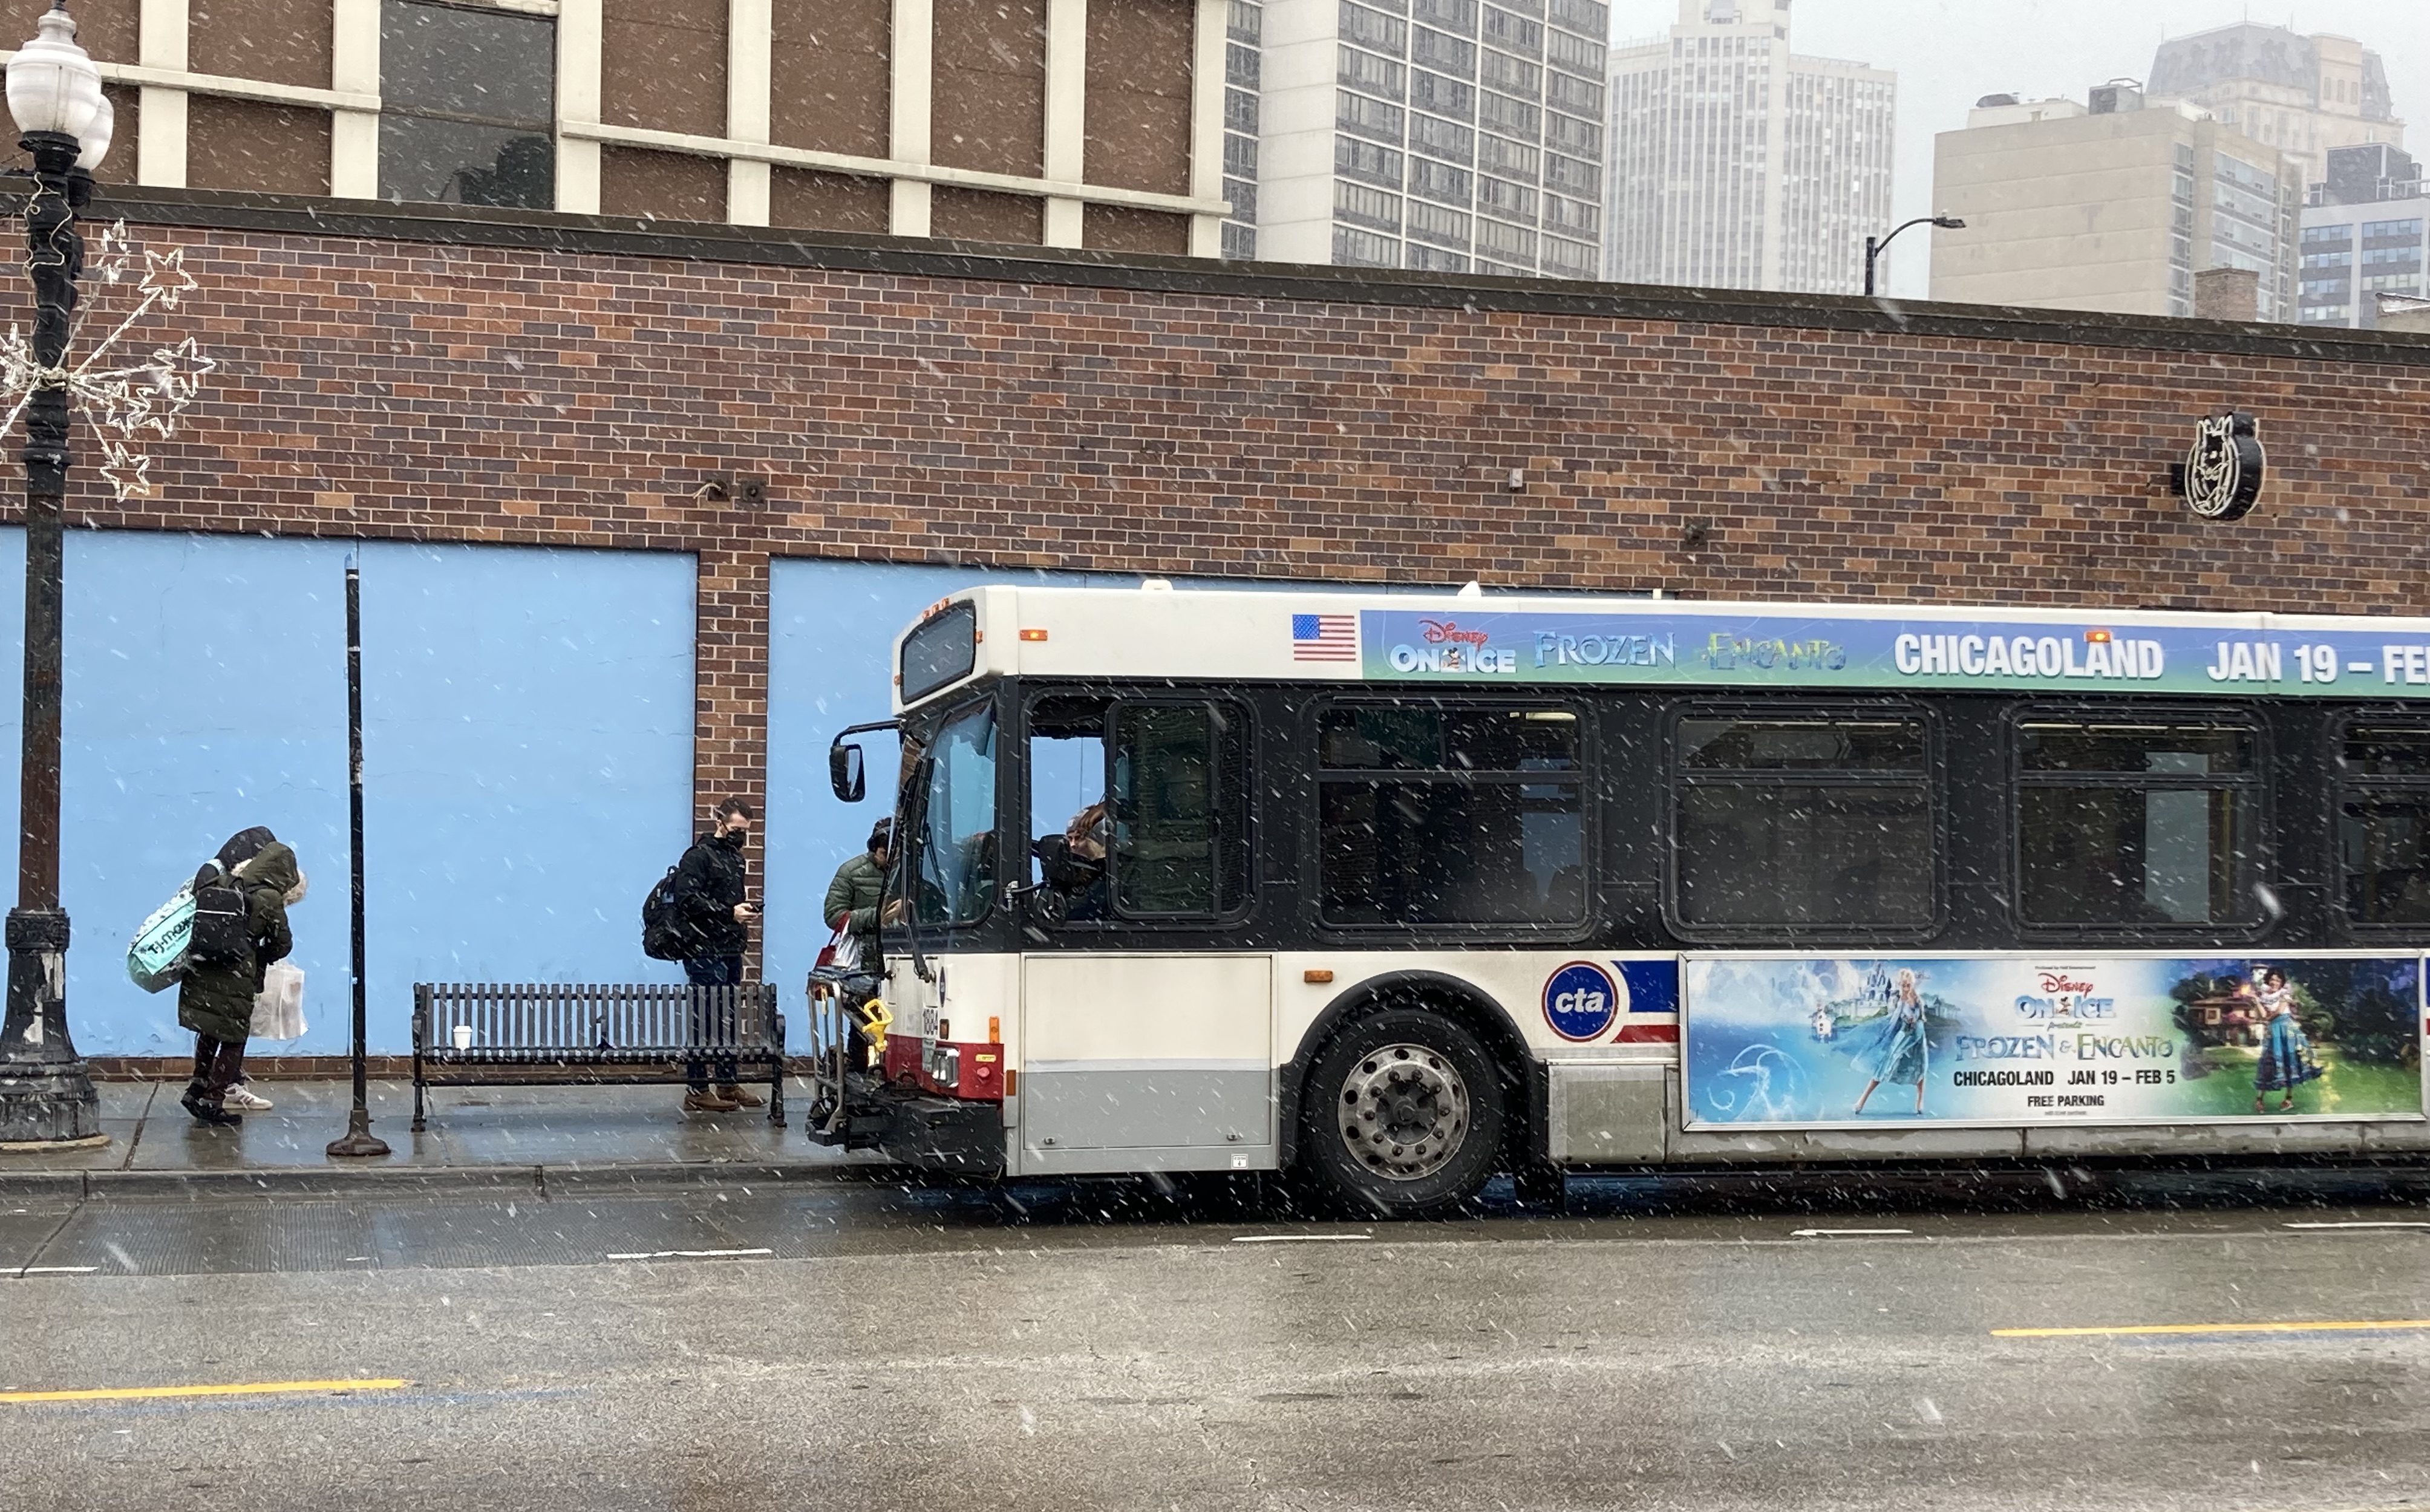
In early January, the CTA announced temporary changes to the schedules of 52 bus routes across the city, following similar edits to the system’s rail schedules announced in mid-September. These short-term cuts to scheduled service, euphemistically called “optimization,” were intended to make wait times more predictable by better aligning the published schedules with current bus and train operator staffing levels.
The changes were also supposed to help with the infuriating “ghost run” problem: buses and trains that appear on Transit Tracker and navigation app screens based on the schedules, only to later disappear from the screens before they show up because there was no one available to drive them. If the CTA is only scheduling runs that it will probably be able to staff, ghosting should become less frequent.
The transit agency is currently trying to get its workforce back to full strength through new financial incentives for current employees and new hires; holding frequent job fairs; and other strategies.
The CTA press release on the rail schedule changes stated, “Certain trips that were previously scheduled – but could not occur because of lack of staff – have been temporarily removed [emphasis added] from the schedules and remaining trips have been re-spaced until more personnel are available.” So the agency was fairly upfront about the fact that scheduled train service had been cut.
However, the recent news release on the cuts to scheduled bus service didn’t actually mention that scheduled “trips… [had] been temporarily removed.” Instead it used vaguer language: “The schedule frequency was adjusted [emphasis added] to reflect the available workforce.”
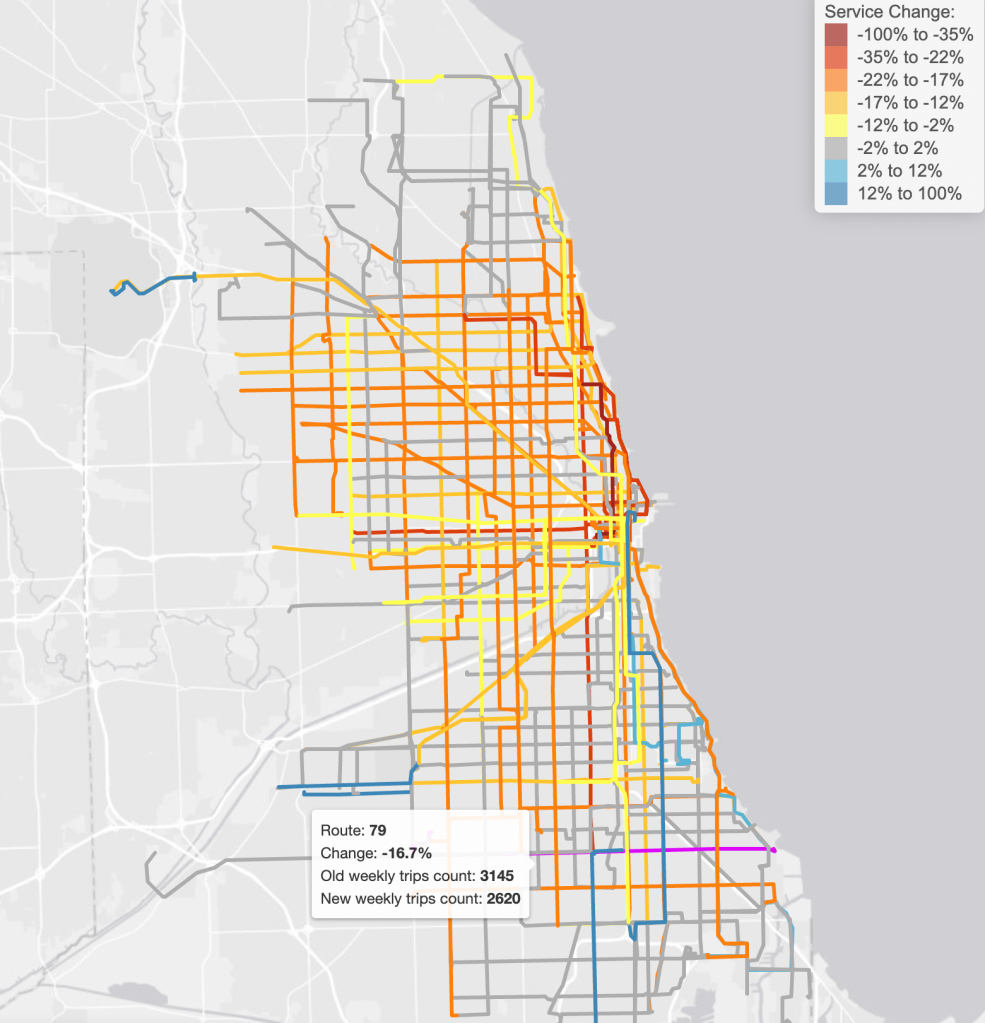
But by how much? “Overall, [scheduled] rail has been cut by 12 percent and bus service by 10 percent,” said Fabio Göttlicher co-founder of the grassroots transit advocacy group Commuters Take Action. Every day the group tweets out the percentage of scheduled ‘L’ runs that were actually fulfilled the previous day, using data provided by cyber security analyst Brandon McFadden.
Commuters Take Action recently published an analysis of the new schedules showing the change in the total number of scheduled trains or buses run for each route. Some routes have been impacted more than others. While the Yellow Line saw no reduction in scheduled service (as opposed to service delivered), the Brown Line saw a 27.9 percent cut in scheduled weekday service, with the number of trains scheduled to run each weekday slashed from 185 to 130.
Two of the three highest-ridership bus routes – the #8 Halsted Street and the #79 79th Street – both saw over a quarter of their previously scheduled weekday runs taken off the schedule. The number scheduled weekday Halsted trips was reduced from 274 to 197, a 28.1 percent decrease. And the number of scheduled 79th runs on weekdays was decreased from 494 to 370, a 25.1 percent drop.
Commuters Take Action posted an interactive map that shows exactly how much the scheduled service has been cut on each route. When you scroll over a line, you’re shown the percentage of weekly scheduled trips removed (or in some cases added), as well as the old and new numbers of runs.
Click here to view the map full-screen. (The map was solely created by Commuters Take Action, which has given Streetsblog Chicago permission to post a full-screen version on the website of SBC cofounder Steven Vance, who had no involvement in creating the map.)
Again, since we’re talking about changes to scheduled service rather than service delivered, rider experience hasn’t necessarily gotten any worse since the “optimization” was done. (Well, not including anomalies like the Polar Vortex and dismal New Year’s Eve performance, which the agency blamed on a high number of unplanned absences by workers.)
Even though delivered service hasn’t been cut under the optimization schemes, Göttlicher says the CTA should have been more straightforward about the fact that scheduled service has reduced, in all of its communications. “If they’re preaching honesty, then they have to be honest.”

Did you appreciate this article? Please consider making a tax-deductible donation to help fund Streetsblog Chicago’s next year of publication. Thanks!

Streetsblog has migrated to a new comment system. New commenters can register directly in the comments section of any article. Returning commenters: your previous comments and display name have been preserved, but you'll need to reclaim your account by clicking "Forgot your password?" on the sign-in form, entering your email, and following the verification link to set a new password — this is required because passwords could not be carried over during the migration. For questions, contact tips@streetsblog.org.