Mapped: Explore our interactive CTA ridership map
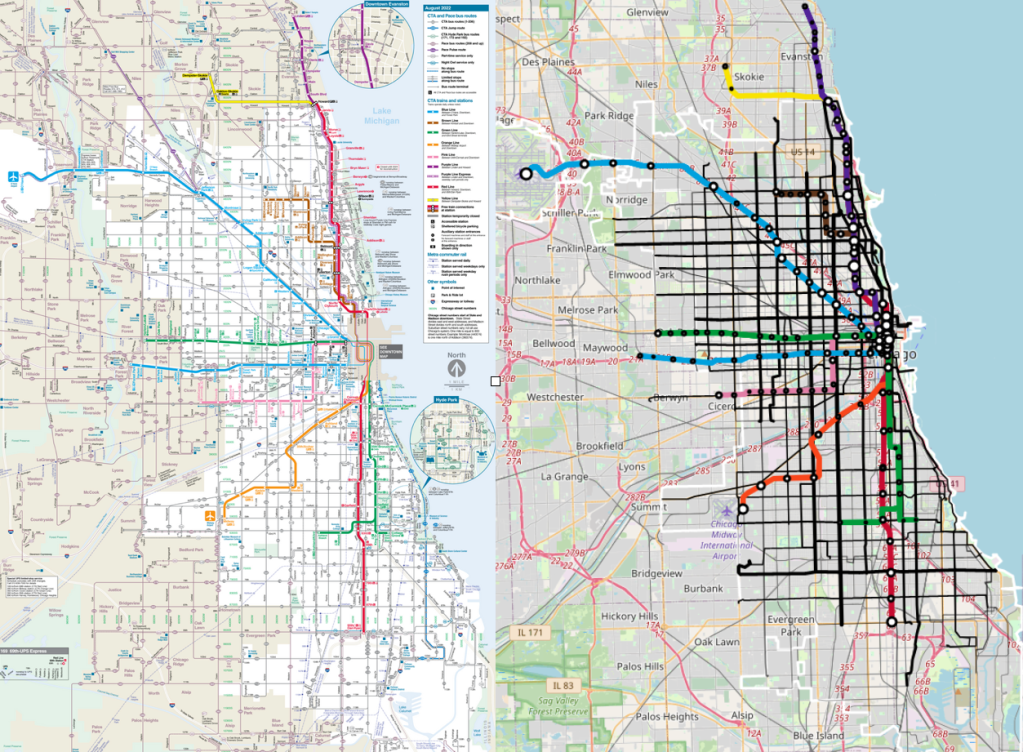
The CTA publishes informational network maps that most riders are familiar with, but what’s less well-known is that they publish daily average ridership statistics for each bus route and train station as well. So I took an interest in combining the two to visually highlight how ridership is spread throughout the CTA network. Before drawing any conclusions it’s important to note that ridership is strongly correlated with frequency of service, so low ridership does not necessarily mean low demand for transit, but could mean low-quality or infrequent service. Keeping that in mind, take a look at the interactive version of the map (based on weekday ridership from May 2022) and explore your most used routes.
Click here to view the map full-screen.
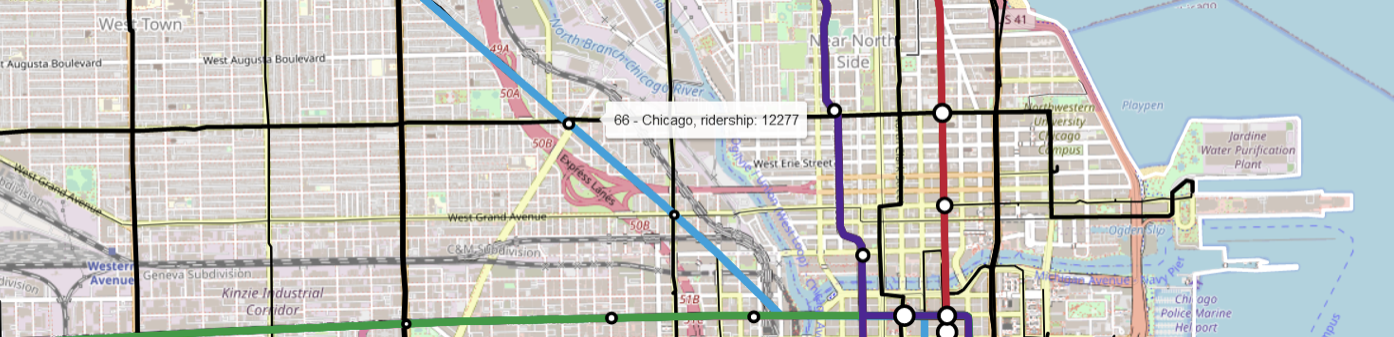
In the map, bus routes are colored black and routes with lower ridership are drawn thinner and more transparent. Train lines are all drawn the same thickness (since we only have station-level boardings and no information on transfers), with stops’ areas scaled to boardings. You can pan, zoom and hover over bus routes and stations to see the available information.
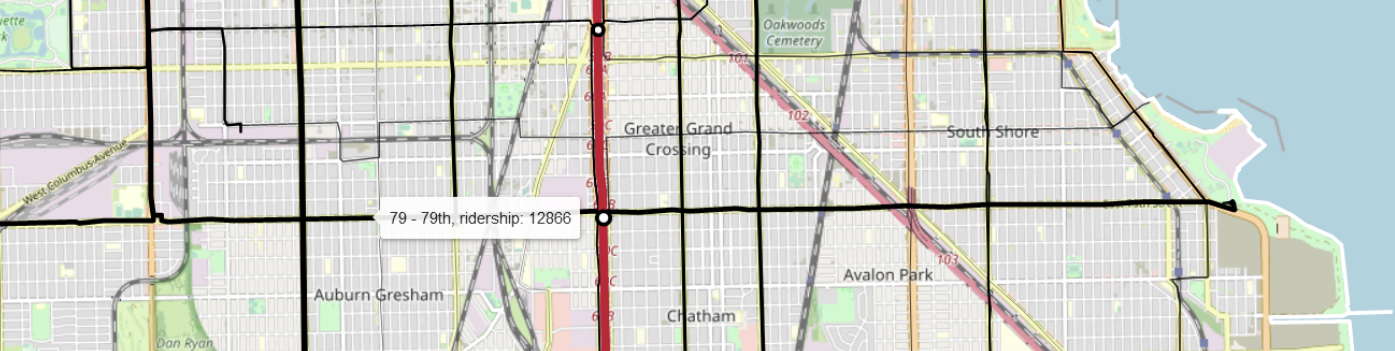
What jumps out to me is how important the bus network is to transit ridership. The 79th Street bus route had about the same daily ridership (12,866) as all the Blue Line stations from LaSalle to Forest Park combined (12,844), and many other routes have comparably high ridership. These numbers are still well below pre-pandemic averages, but speak to the importance of buses not only in supplementing rail but as a transit modality in their own right. Looking at the map, it’s not hard to see that many of these routes lie where rail service is absent or going in the opposite direction of travel, and given the lower cost of bus service in comparison to rail, it’s quite impressive that ridership is as high as it is. Further, most of these routes have few or no bus priority treatments – bus lanes, signal priority or bus boarding bulbs or islands, to name a few – the introduction of which would improve quality of service and bolster ridership.
Several segments stand out as being important for bus ridership and connecting high-ridership rail stops. There’s Chicago Avenue between Ashland and Michigan Avenue, which connects the high-ridership Ashland Avenue route with high-ridership stations on the Blue, Brown, Purple and Red lines, as well as with the high-ridership 3, 146 and 147 north-south routes. Fortunately, much of this area is already planned for dedicated bus lanes.
Similar projects exist for the 79th Street corridor, but they are unfortunately limited to small stretches of only a few blocks in zones of especially low traffic. Given that the 79th Street route has higher ridership than Chicago Avenue and connects routes like Western, Ashland, Halsted, the Red Line, King and Cottage Grove, a more comprehensive bus priority treatment seems appropriate.
Finally, there is no mention of bus priority treatments for the highest ridership north-south route, Ashland Avenue, despite its heavy use and connections between the Orange, Pink, Blue, Green, and Brown lines, not to mention all the high-ridership east-west bus routes. This may be related to car-centric backlash that killed plans for full-fledged BRT along Ashland in the 2010s, but less ambitious priority projects should still be on the table.
What would be even more useful is bus stop-level ridership information, which the CTA does not seem to currently provide (outside of a single dataset from October 2012). Stop-level ridership information would be useful to identify bus stop balancing candidates, or to prioritize segments of routes that have particularly high ridership. Let us know in the comments how you think this interactive map could be improved, or what other Chicago data visuals you’d like to see.
Daniel Cruz is an analytics professional and urbanist who is enthusiastic about data visualization, analysis and urban transportation and land use.

Streetsblog has migrated to a new comment system. New commenters can register directly in the comments section of any article. Returning commenters: your previous comments and display name have been preserved, but you'll need to reclaim your account by clicking "Forgot your password?" on the sign-in form, entering your email, and following the verification link to set a new password — this is required because passwords could not be carried over during the migration. For questions, contact tips@streetsblog.org.