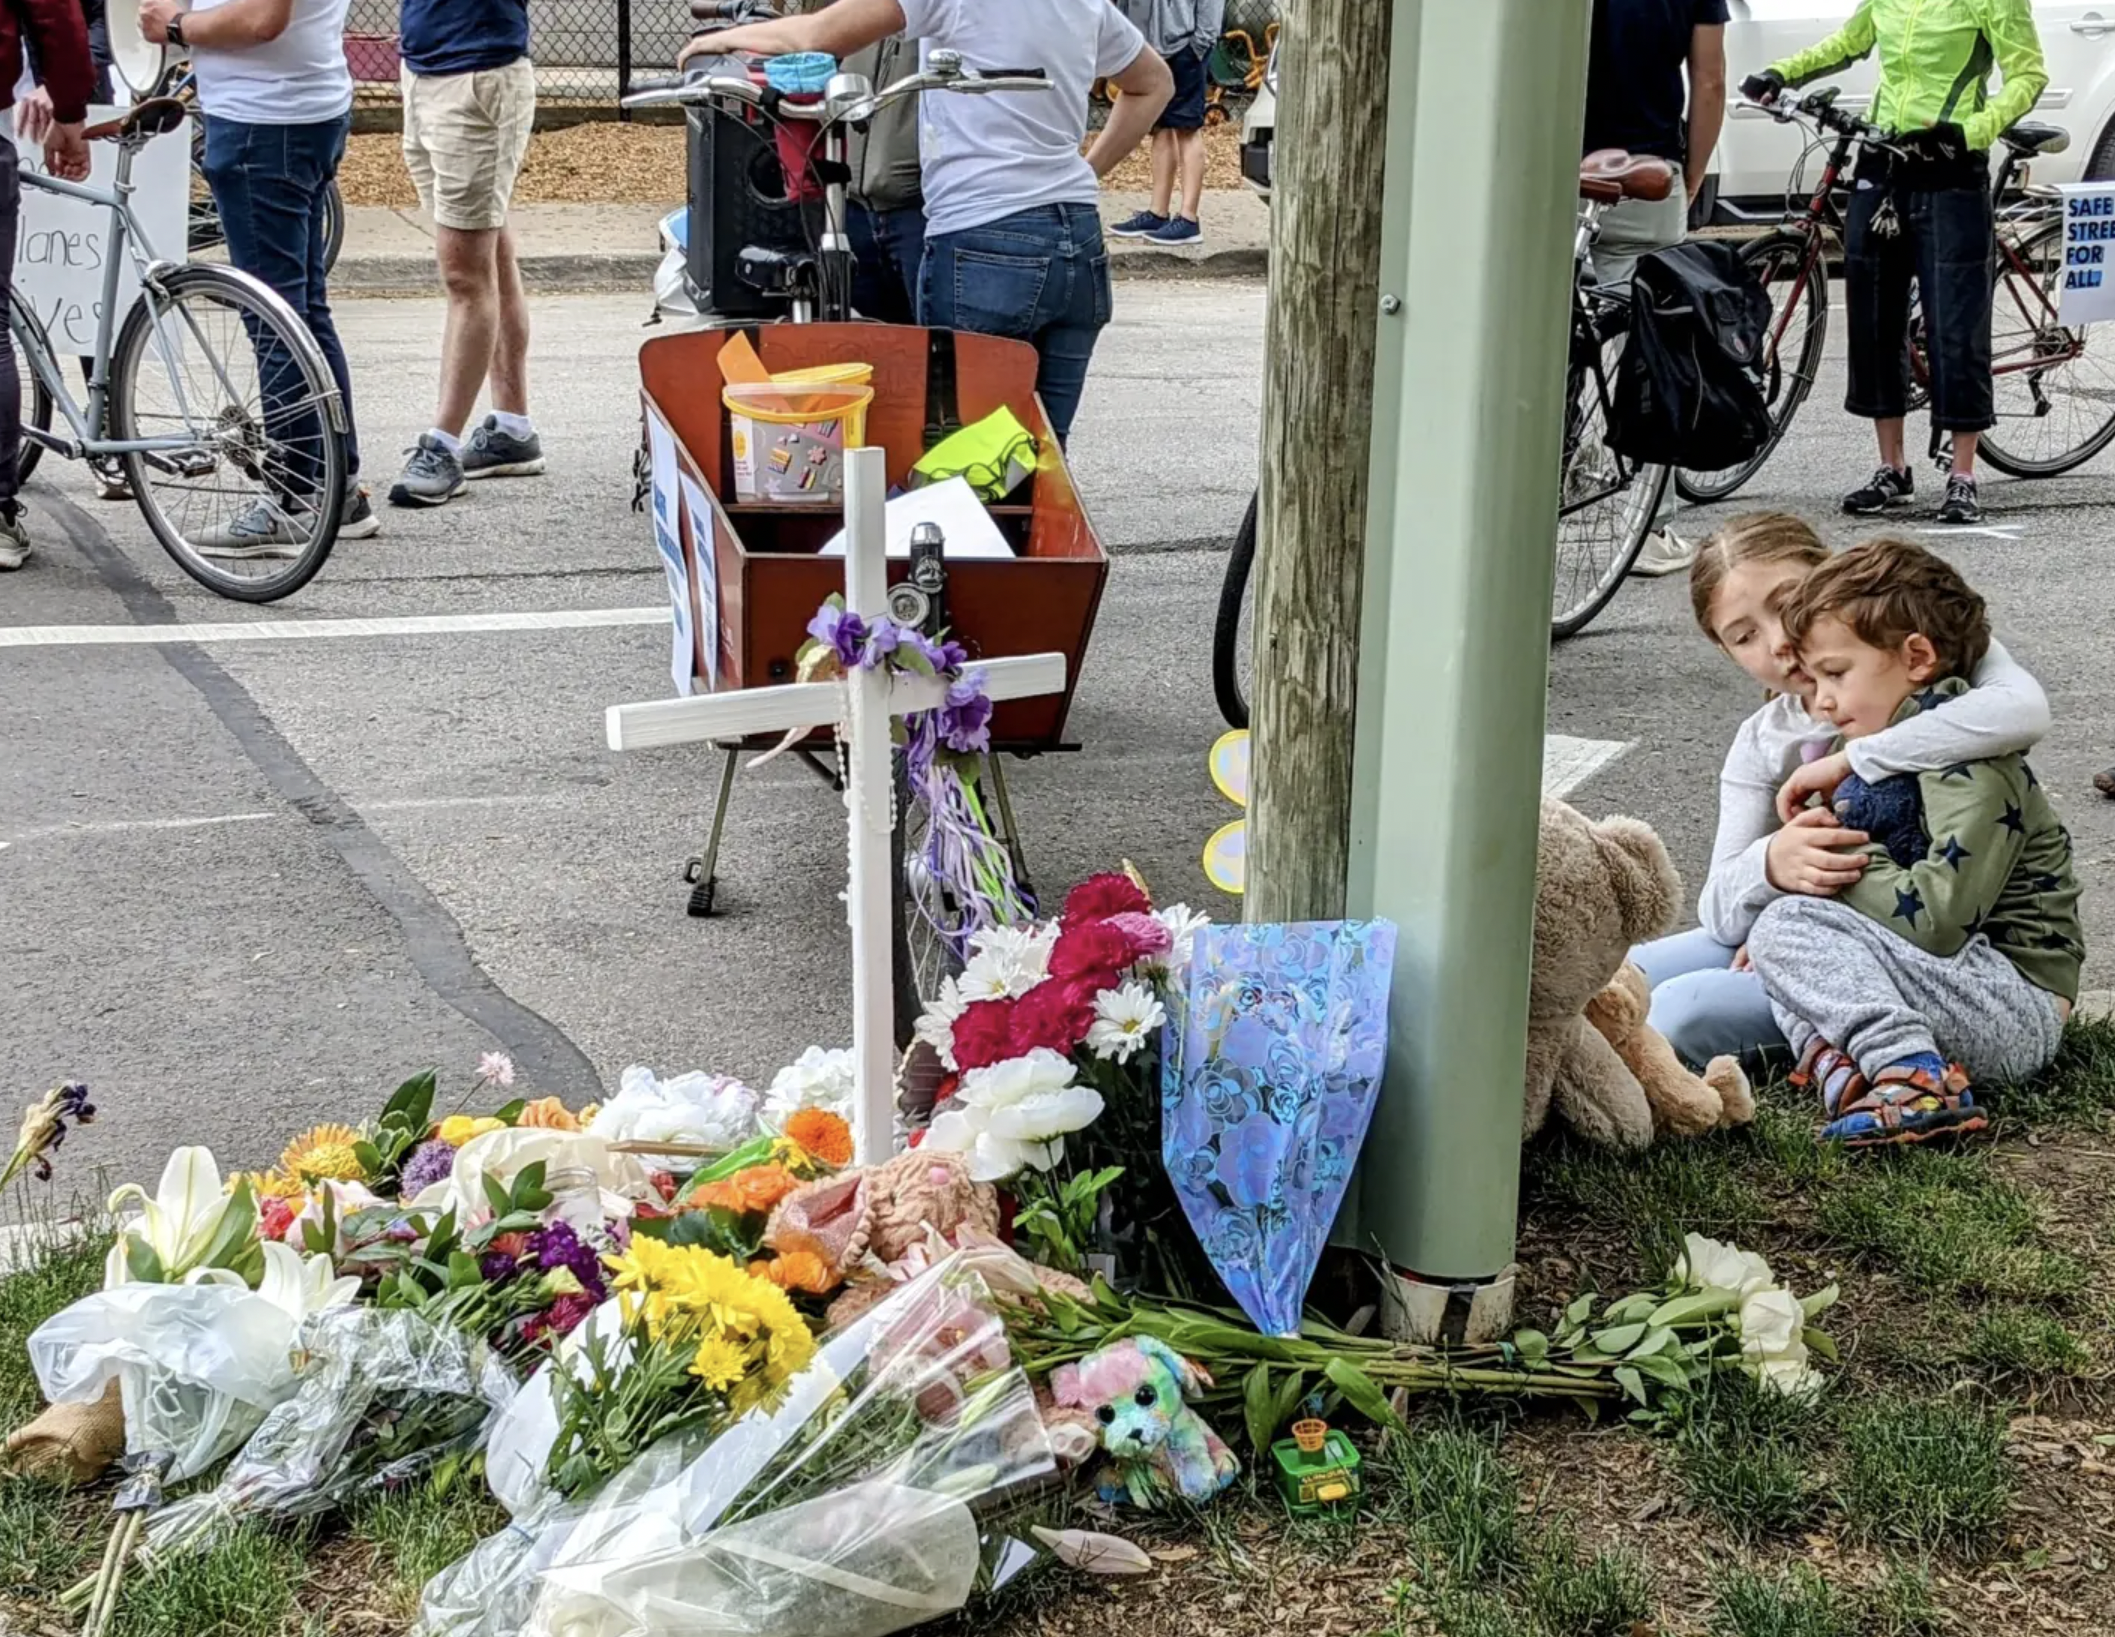
Editor's note: I haven't done a close analysis of the People for Bikes city rankings methodology, and I agree with the overall findings that Chicago has a long way to go before it's a truly bike-friendly city. But I maintain that the rankings, which put Chicago in 99th place out of 104 large cities around the world – behind such noted bicycling paradises as Dallas (97th place), Houston (93rd), Memphis (88th), Jacksonville (83rd), Oklahoma City (73rd), Atlanta (68th), Los Angeles (58th), Phoenix (56th), Omaha (54th), and St. Louis (51st) – are largely absurd. See the full large U.S. city rankings at the bottom of this post.
As I wrote in 2016, Bicycling magazine rating Chicago the best U.S. city for cycling that year was debatable. However, People for Bikes ranking Chicago behind dozens of more car-centric, sprawled cities with relatively few bikeways, low bike mode shares, and much higher bike fatality rates, makes even less sense.
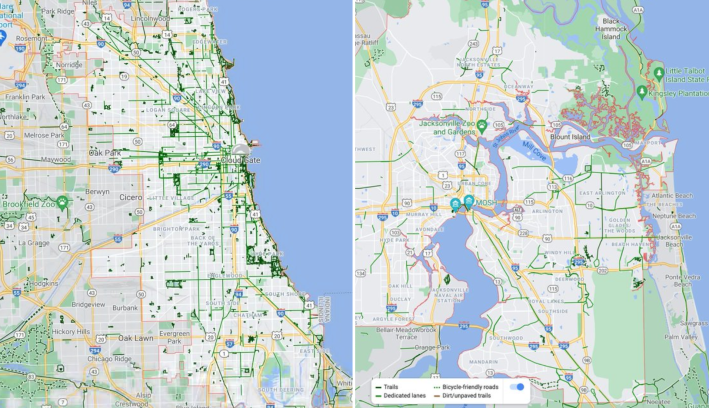
For example, For example, People for Bikes ranked Chicago 16 places behind, Jacksonville, Florida, population 890,467, a city with no rapid transit and the second-lowest population density of any large U.S. city. It's basically a worst-case scenario of car-centric sprawl, with relatively few bikeways.
In 2016, Chicago's bike mode share was 1.7%. Jacksonville's was less than half that, at 0.7%. In 2018 & 2019, Chicago saw six and four bike deaths, respectively. Jacksonville, with about a third of the population of Chicago, saw 10 deaths both years, which means it had about six times the bike fatality rate as our city. Clearly, People for Bikes ranking Chicago far below Jacksonville and many other similarly car-centric, bike-hostile cities, is off-base.
– John Greenfield
Lmao there’s no way. Not St. Louis 😂
— Christian M. (@__cinez) July 19, 2021
Colorado-based nonprofit People For Bikes recently issued their annual report that evaluates the bicycle-friendliness of over 700 cities worldwide. In last year’s report, Chicago ranked low—1.7 on a scale of 5. Under the new, simplified system based on the safety and connectivity of the bike network and survey feedback, the Windy City scores an abysmal 16 out 100, placing it in the bottom 5 percent of large cities.
Kyle Wagenschutz, vice president of local innovation at PFB, said the new system homes in on areas that have the biggest potential for change, and clearly illustrates that Chicago has “substantial room for improvement.”
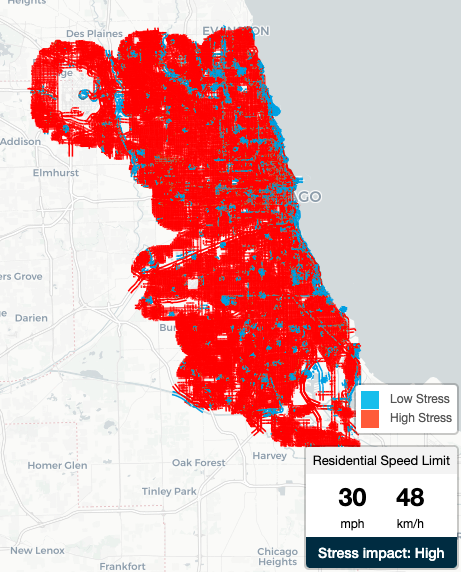
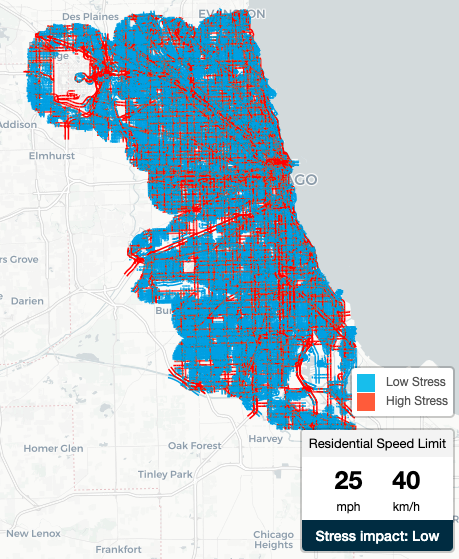
One change that would have sweeping and immediate impact on the PFB scale is Chicago’s default 30 mph residential speed limit. As the Active Transportation Alliance notes in a recent blog post on the PFB score, a person hit by a driver traveling at 20 mph has a 90 percent chance of survival. At 30 mph the survival rate drops to 50 percent. If Chicago were to lower the default speed limit to 25 mph, all residential streets would be reclassified from high-stress to low-stress, painting the PFB heat map blue and goosing Chicago’s bike-friendly street network score from a pitiful 5 to 35.
Of course, lower speed limits alone don’t automatically change the habits of lead-footed drivers. They are most effective when paired with traffic calming infrastructure like bump outs, speed bumps and chicanes.
Streetsblog editor John Greenfield questioned whether Chicago’s quiet side streets can fairly be called “high-stress.” When I put the question to Wagenschutz, he conceded the inherent weaknesses of standardized systems, but felt the overall rating methodology was a sound reflection of reality. “We have to draw a line in the sand somewhere,” he said. “And if things are so hunky-dory [in Chicago], why aren’t we seeing Amsterdam levels of cycling there? We could talk about the merits of the limitations of the data and what’s best, but we should be clear that [Chicago is] still 50 points behind a great cycling city.” Amsterdam, the number 2-ranked big city on the PFB scale, has a network score of 86.
The Active Transportation Alliance is considering proposing state-level legislation that would make a change to Chicago’s default residential speed limit possible. State law must be modified for Chicago to pass ordinances to change speed limits in neighborhoods or citywide. ATA spokesperson Kyle Whitehead said these efforts are in the early stages but the hope is to introduce legislation in January 2022.
The second big ding in Chicago’s network score is lack of connectivity between a patchwork of protected bike lanes. ATA has been pushing for the Chicago Department of Transportation to make progress on the CDOT's now decade-old plan to build a cohesive network of bikeways, preferably protected ones, across the city, and currently has a petition urging the city to build 10 more miles of protected bike routes by 2023 and 30 more miles by 2026. These are modest goals, especially when compared to unfulfilled promises made by both the Rahm Emanuel (build 100 miles of protected lanes built in his first term) and Lori Lightfoot administrations (build 50 miles of protected lanes.) And that's not to mention progress made by peer cities like New York, which constructed almost 30 miles of protected bike lanes last year alone.
Whitehead said the idea was to push for something easily attainable, especially in light of the city’s capital plan, which allots $150 million for Complete Streets, a portion of which will be allotted for bike infrastructure. “We continue to be frustrated at the lack of progress,” he said. “We have a protected bike lane here and a protected bike lane there. Those are good and we support those projects, but they’re not getting us all that closer to our goal of a connected network so people can get from point A to point B.”
ATA recommends prioritizing “spoke routes” on major arterial streets, particularly on the south and west sides, where streets are wider, vehicles tend to drive faster and heavy truck traffic all converge to make biking more stressful. Whitehead also noted that the lack of connectivity is an issue in pretty much every neighborhood outside of downtown.
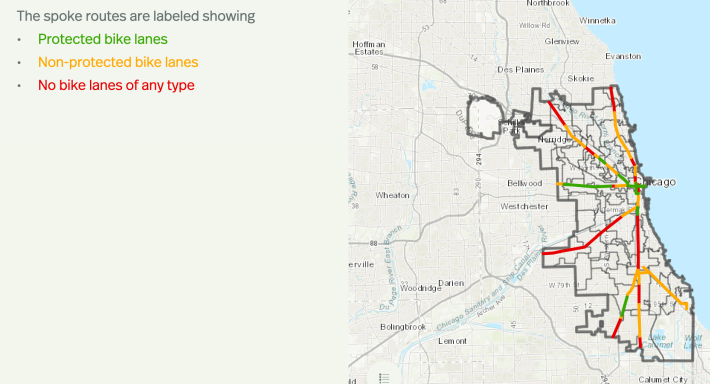
Wagenschutz concurs that these two efforts—lowering the speed limit and building a network of protected bike lines—is where Chicago should concentrate energy and resources to encourage more people to use bikes for transportation and recreation. “Can [Chicago] go out tomorrow and educate an entire city about riding bikes? Yeah, [Chicago] can do that, but will they believe it when they look out their door and there’s no bicycling in front of their house, or when they get to that first intersection and it’s just a little too scary to navigate?” he said. “There’s a give and take between people’s perception of what things are like and the stark reality of what the built environment actually permits them. What we’re focused on is changing the built environment.”
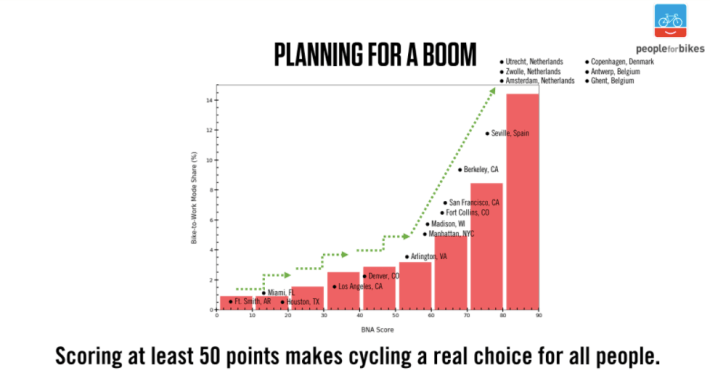
According to Wagenschutz, these changes could quickly bring Chicago’s network score up to 50, a tipping point at which PFB sees ridership in other cities increase exponentially. “We think it’s because those friends and neighbors you’re trying to convince to ride a bicycle, they can go outside and see how the bicycle network connects them to parks or grocery stores or their workplaces and they can see how it’s a viable means of transportation,” he said. “You become connected enough that you create the belief in people that bicycling can be a practical choice. We’re encouraging any city scoring below 50 to make propping up that score the highest priority. Once you hit 50, then you can focus on education programs, and those activities will have greater impact.”
The large U.S. city rankings
Here are the People for Bikes rankings for large U.S. cities and New York City boroughs out of 104 large cities (over 300,000 people) in multiple countries, from worst to best. Where available from a 2018 League of American Bicyclists report, 2017 bike mode share (the percentage of commuters who primarily get to work by bike) is included in parenthesis.
Bizarrely, PFB ranked 33 large U.S. cities above Chicago that all had less than half of Chicago's 1.7% mode share. Omaha, ranked 45 places ahead of Chicago, had a 0.2 percent mode share, or less than one-eighth of Chicago's.
Read the full ranking of all 104 large cities in multiple countries here.
- 104. Arlington, TX, U.S. (0.1%)
- 103. Miami, FL, U.S. (0.9%)
- 101. Corpus Christi, TX, U.S. (0.6%)
- 100. El Paso, TX, U.S. (0.0%)
- 99. Chicago, IL, U.S. (1.7%)
- 98. Wichita, KS, U.S. (0.2%)
- 97. Dallas, TX, U.S. (0.3%)
- 96. Fort Worth, TX, U.S. (0.1%)
- 94. Indianapolis, U.S. (0.4%)
- 93. Houston, TX, U.S. (0.3%)
- 92. Louisville, KY, U.S. (0.3%)
- 91. Nashville, TN, U.S. (0.2%)
- 90. Lexington, KY, U.S. (0.5%)
- 89. Bakersfield, CA, U.S. (0.6%)
- 88. Memphis, TN, U.S. (0.2%)
- 87. Tampa, FL, U.S. (0.7%)
- 86. San Antonio, TX, U.S. (0.2%)
- 85. Baltimore, MD, U.S. (1.1%)
- 84. Austin, TX, U.S. (1.2%)
- 83. Jacksonville, FL, U.S. (0.6%)
- 82. Anaheim, CA, U.S. (0.7%)
- 81. Aurora, CO, U.S. (0.2%)
- 80. Raleigh, NC, U.S. (0.3%)
- 79. Honolulu, HI, U.S. (1.7%)
- 78. Virginia Beach, VA, U.S. (0.6%)
- 77. Tulsa, OK, U.S. (0.2%)
- 76. Fresno, CA, U.S. (0.3%)
- 75. Riverside, CA, U.S. (0.5%)
- 74. Mesa, AZ, U.S. (1.2%)
- 73. Oklahoma City, OK, U.S. (0.2%)
- 72. Las Vegas, NV, U.S. (0.2%)
- 71. Cincinnati, OH, U.S. (0.6%)
- 70. Charlotte, NC, U.S. (0.2%)
- 69. Cleveland, OH, U.S. (0.4%)
- 68. Atlanta, GA, U.S. (1.2%)
- 67. Pittsburgh, PA, U.S. (1.4%)
- 66. San Jose, CA, U.S. (0.8%)
- 65. Columbus, OH, U.S. (0.8%)
- 64. Henderson, NV, U.S.
- 63. Long Beach, CA, U.S. (0.9%)
- 62. Albuquerque, NM, U.S. (0.9%)
- 61. Kansas City, MO, U.S. (0.1%)
- 59. San Diego, CA, U.S. (1%)
- 58. Los Angeles, CA, U.S. (0.9%)
- 57. Boston, MA, U.S. (2.2%)
- 56. Phoenix, AZ, U.S. (0.8%)
- 55. Sacramento, CA, U.S. (1.8%)
- 54. Omaha, NE, U.S. (0.2%)
- 53. Staten Island, NY, U.S.
- 51. St. Louis, MO, U.S. (0.8%)
- 50. Milwaukee, WI, U.S. (1%)
- 49. Tucson, AZ, U.S. (2.5%)
- 48. Oakland, CA, U.S. (2.3%)
- 46. New Orleans, LA, U.S. (2.9%)
- 45. San Juan, Puerto Rico, U.S.
- 44. Colorado Springs, CO, U.S. (0.5%)
- 42. Denver, CO, U.S. (2.2%)
- 41. Minneapolis, MN, U.S. (3.9%)
- 40. Washington, D.C., U.S. (5%)
- 37. The Bronx, NY, U.S.
- 35. Detroit, MI, U.S. (0.7%)
- 34. St. Paul, MN, U.S. (1.4%)
- 31. Philadelphia, PA, U.S. (2.6%)
- 24. Portland, OR, U.S. (6.3%)
- 23. Queens, NY, U.S.
- 22. Manhattan, NY, U.S.
- 21. Seattle, WA, U.S. (2.8%)
- 17. San Francisco, CA, U.S. (3.1%)
- 14. Brooklyn, NY, U.S.
