[This article also ran in the Chicago Reader.]
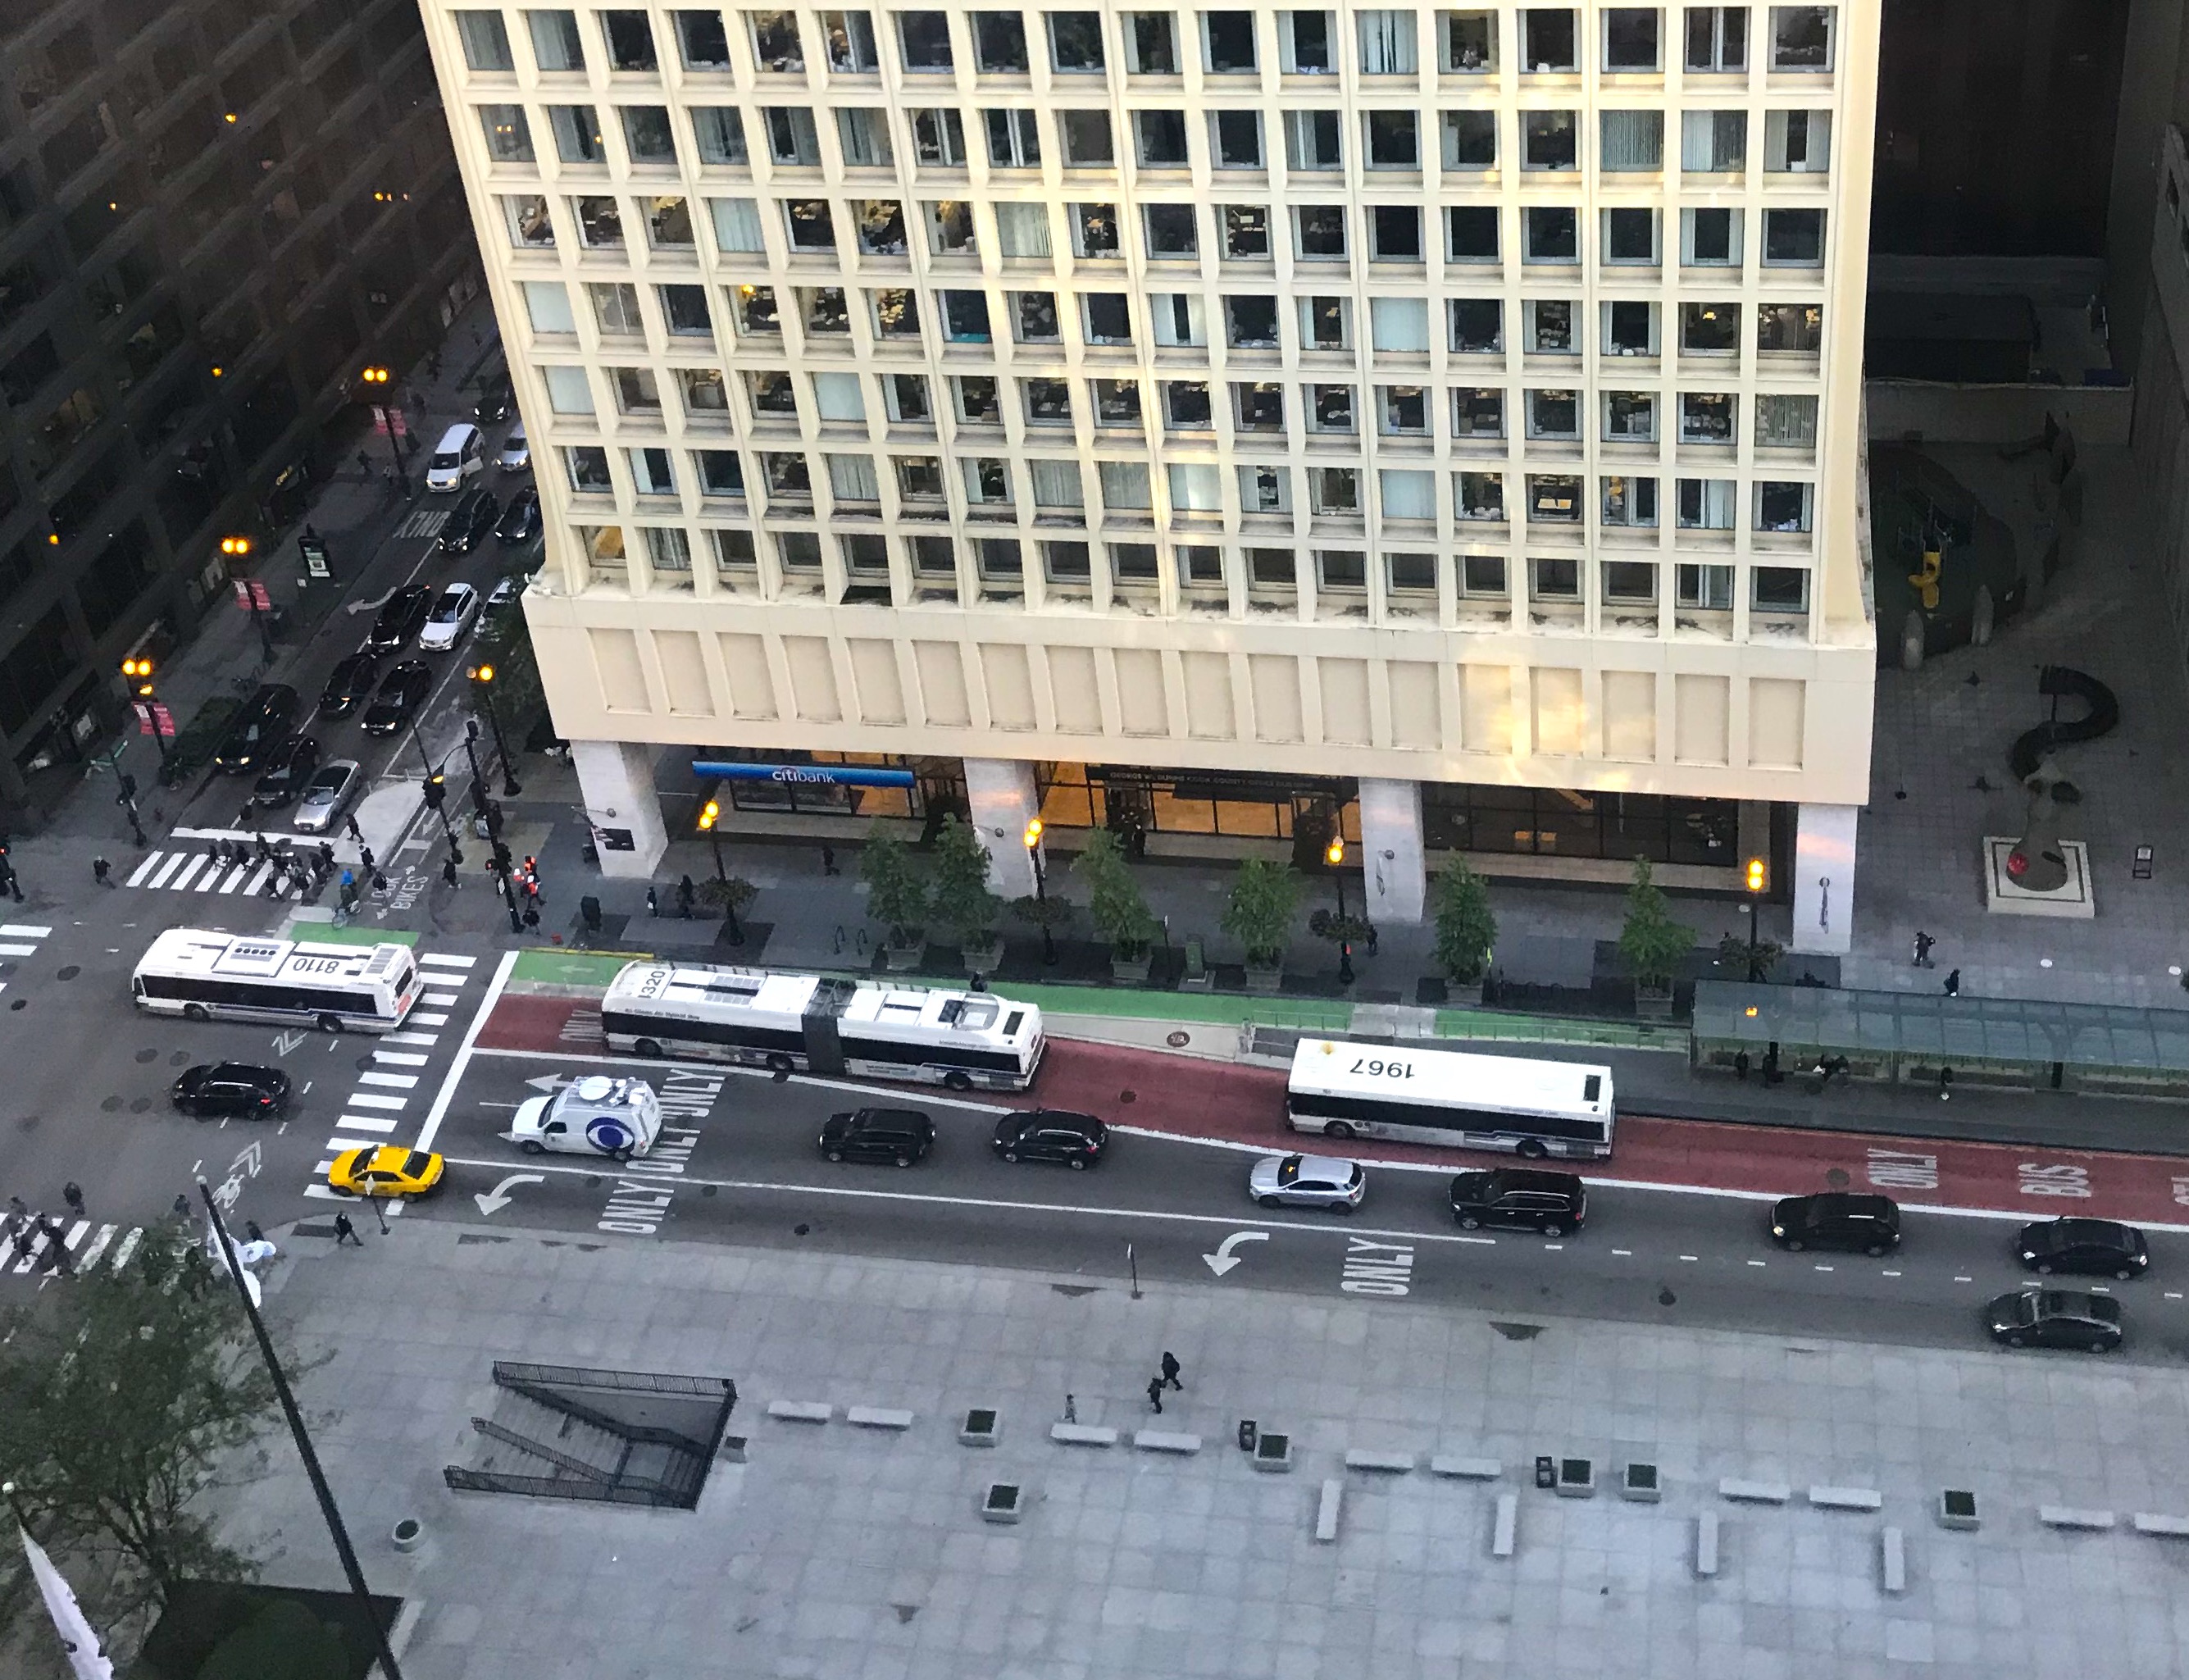
For years my feelings about Chicago’s $41 million Loop Link bus rapid transit corridor have been like those of a parent whose loveable kid has been getting mediocre grades. I’m proud of what it is: A smart reconfiguration of downtown streets to help move people -- not just cars -- more efficiently through the city. But I’ve been concerned that it’s not quite living up to its full potential.
Loop Link debuted in December 2015 with the goal of speeding up service between Michigan Avenue and the West Loop on seven CTA routes from the previous, glacial 3 mph rush-hour average, to a modest 6 mph. As part of the project, the Chicago Department of Transportation remixed Canal, Clinton, Randolph, Madison, and Washington, adding red bus-only lanes on most of the streets, plus eight bus stations with giant, rake-like shelters on the latter two roadways.
As part of the project, CDOT constructed the Union Station Transit Center to ease transfers between buses and Metra and Amtrak trains. The department built protected bike lanes on Canal, Randolph, and Washington. And converting excess mixed-traffic lanes to bus and bike lanes created shorter crossing distances for pedestrians and calmed motor vehicle traffic.
Despite those benefits, it’s been unclear whether Loop Link has achieved its main goal of doubling bus speeds. In addition to the car-free lanes, time-saving features include fewer stops, raised boarding platforms at the stations (so operators spend less time “kneeling” the bus for people with mobility issues), and white “queue jump” signals that give buses a head start at stoplights.
But even though the city originally said Loop Link would launch with prepaid boarding, which reduces the “dwell time” at bus stops, almost three years later it still hasn’t rolled out that feature. It’s also common to see unauthorized vehicles, especially corporate shuttles using the red lanes, which doesn’t help CTA travel times.
Using traffic cameras to enforce the lanes would require approval from Springfield, and the cams are highly unpopular in the wake of Chicago’s red light bribery scandal. (Similar express bus systems like New York City’s Select routes feature both prepaid boarding and camera enforcement.)
Many Latin American BRT systems use curbs to help keep private cars out of the bus lanes. However CDOT spokesman Mike Claffey said this idea was rejected because higher concrete curbs would make it difficult for CTA buses to pass illegally parked vehicles or stalled buses in the lanes, while low plastic curbs could be damaged by snow plows.
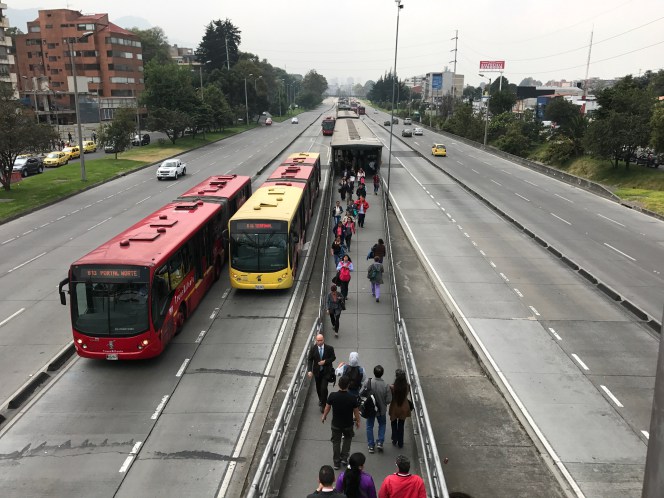
When the Loop Link corridor first opened, there seemed to be little improvement in bus speeds, partly due to an infuriating rule requiring the operators to approach the raised platforms at a 3 mph crawl to avoid clocking customers with their mirrors. That decree was eventually relaxed, and when I test rode the system in early 2016, trip times seemed to have shortened a bit, although they were still well above the CTA’s goal of eight minutes for a cross-Loop journey.
Since then, whenever I’ve asked CTA officials for an update on Loop Link performance, they’ve provided vague statements about improved customer satisfaction but declined to provide hard numbers, promising that the agency would release a report sometime in the future.
Recently I got tired of waiting, so I filed a Freedom of Information Act request seeking all internal documents with data on the corridor’s effects on bus speed and reliability. It turns out that the CTA has already put together a Loop Link performance report, but officials wouldn’t share the whole thing with me, citing a loophole in the FOIA rules that excuses them from releasing preliminary drafts. However they sent a number of charts and graphs from the study.
In a nutshell, the corridor’s performance has been a mixed bag. While the system has generally seen moderate improvements in recent years, in some cases travel times have actually gotten worse. However, that’s not necessarily the system’s fault, as I’ll explain a bit.
CTA staffers documented downtown bus performance in 2013, as they were planning the corridor, so that serves as the baseline for the current study. For example, in 2013 the total median time for an eastbound 8 a.m. run from Union Station to Washington/State, a distance of one mile, was about 12 minutes and 40 seconds. That’s roughly 4.7 mph, or a slow jogging pace.
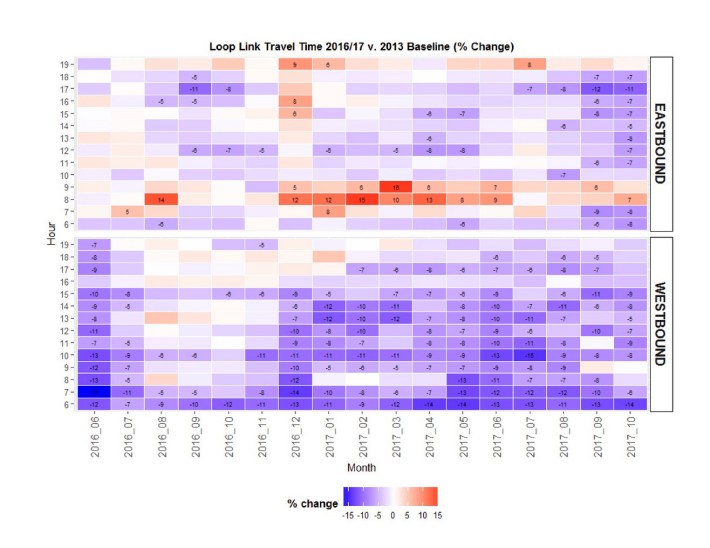
One table from the FOIA response (above) gives an overview of Loop Link travel times in 2016 and 2017 compared to the 2013 baseline. Decreases in the duration of the cross-Loop trip (good) are shown in shades of purple and blue, while increases (bad) are depicted with orange and red hues.
Westbound, it appears that service has generally improved. Almost all of that section of the chart is lavender or violet, with modest decreases in travel times of up to 17 percent, although times haven’t improved so much during the evening rush, when most people are heading west out of the Loop.
The outlook for eastbound trips is less rosy, because there’s more red on the chart. Particularly during the morning rush, when most commuters are heading east into town, there are blocks of deep crimson, where travel times have increased by as much as 16 percent.
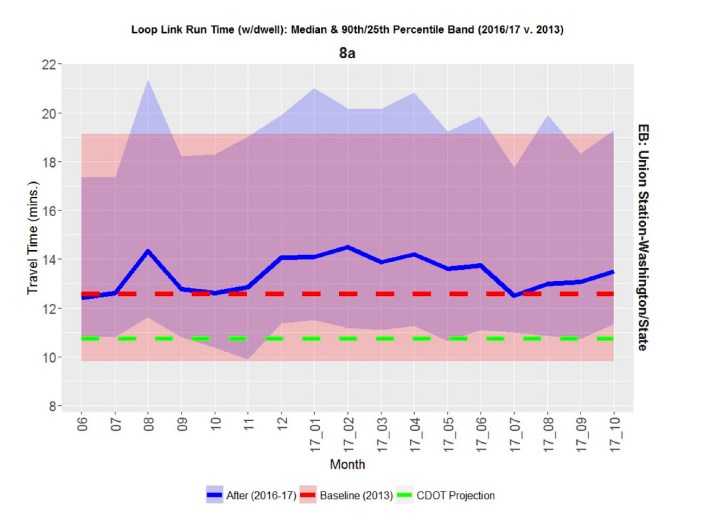
Another graph (above) illustrates Loop Link’s challenges with providing reliable service, which is one of the purposes of a BRT system. A red line on the chart shows the 2013 baseline of 12:40 for an eastbound cross-Loop trip at 8 a.m. A green line shows the projected improved trip time of about 10:50, or roughly 5.5 mph. A zigzagging blue line shows the median trip times during the post-Loop Link debut counting period, which basically never drops below the baseline.
A wide blue band on the graph, which oscillates wildly, represents the 90th/25th percentile band. This means that 25 percent of the runs had a lower travel time than the band’s bottom edge, while 10 percent of the trips had a higher travel time than the band’s top edge. Since almost all of the blue band is above the green projection line, that means the vast majority of trips didn’t meet that 10:50 goal.
While the graphics indicate that Loop Link hasn’t resulted in any dramatic speed improvements, and in some cases trip times have gotten worse, that may be partly due to factors beyond the CTA’s control. One thing that’s happened during the last five years is the rise of ride-hailing, which studies have shown is increasing congestion in large cities.
Another factor could be the recent boom in online retail, which has likely increased the number of downtown deliveries. Earlier this month CBS Chicago reported on numerous cases of Post Office, FedEx, and UPS drivers stopping in signed “No Standing” zones, creating traffic bottlenecks. (CBS called the bus- and bike-centric layout of Washington Street “the crux of the problem,” as opposed to the drivers’ decisions to break the law.) While the red lanes should theoretically make CTA buses immune to traffic jams, that’s not the reality because they’re not well enforced, and that’s unlikely to change anytime soon.
So that leaves prepaid boarding as the best hope for cutting travel times, but the CTA has been dragging its feet about implementing that feature. In fairness, it’s a somewhat tricky problem. NYC’s Select bus routes have kiosks at every stop where you buy a ticket before boarding, and then fare inspectors occasionally ask for proof of payment. But since the Loop Link corridor represents only a small portion of the CTA routes that use it, that method probably wouldn’t work unless kiosks were installed at every stop along all seven routes, which would require a major investment.
It would also be challenging to retrofit the Chicago bus stations with turnstiles in such a way that scofflaws couldn’t simply bypass them by walking in the street and then stepping up onto the boarding platform.
In fall 2016 the CTA did a three-month pilot in which employees were stationed at the busy Madison/Dearborn Loop Link stop with a portable fare card reader during the evening rush, so that customers could pay before the bus arrived. Since summer 2016 the agency has been using the same method at the Belmont Blue Line station.
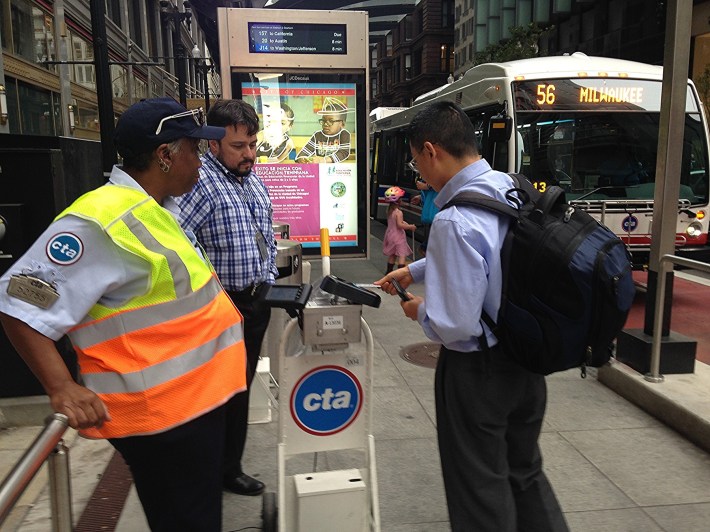
“The Belmont Blue Line station has been very successful and we have seen positive results in time savings,” spokesman Steve Mayberry told me, adding that the system will be made semi-permanent as part of the Belmont Blue Gateway rehab project, currently under construction.
However, the Madison/Dearborn test was deemed a flop. “Unfortunately, we saw only a minimal reduction in boarding times, which did not lead to any travel time savings,” Mayberry said.
The boarding time savings at Belmont, where large numbers of people coming off the train board buses at the same time, averages 38 seconds. But at Madison/Dearborn, where fewer people board any given bus, the savings only averaged 16 seconds. In addition, since the Loop Link stations have two entrances, staffing costs were higher.
“That said, we continue to look for ways to implement prepaid boarding in other [non-Loop Link] locations,” Mayberry said.
So the BRT system isn’t particularly fast and, with camera enforcement and prepaid boarding off the table for the foreseeable future, it’s unlikely to get much faster anytime soon. I don’t mean to throw the CTA under the bus here, but when it comes to dramatically improving transit commute times, Loop Link has turned out to be something of an underachiever.
So does that mean that the Loop Link corridor is an overall failure, or that it should be dismantled to give more real estate to private motor vehicles again?
Mayberry says no. “Loop Link has shown that you can have a bus lane and not cause Carmageddon,” he said. “It’s the heart of downtown and, while there will always be tough traffic days downtown for any number of reasons, Loop Link has not been responsible for negatively affecting traffic. In fact, it’s raised the profile of bus service in the corridor and made it more obvious how much service we run and made our bus service more accessible for people.”
He added that while CTA bus ridership has been falling in recent years, largely due to ride-hailing and increased traffic congestion, ridership at Loop Link stops has steadily grown since the system launched, averaging a two percent increase so far this year compared to 2017. “When you look at the overall project, those are points of success.”
I’d also point out that Loop Link has better organized the streets along the route, especially Canal Street by Union Station, and has created better conditions for walking and biking, while discouraging speeding by private drivers, which makes everyone safer.
And then there’s question of what bus speeds would be like nowadays if Loop Link hadn’t been built, given the general increase in downtown car traffic in recent years. It’s likely that the first table discussed in this article would have more orange and red squares, and the blue line in the graph would be higher above the baseline, signifying even longer trip times for straphangers.
So while the FOIA-ed data suggests that you can’t call Loop Link a roaring success, it would also be wrong to dismiss it as a dismal failure. Rather, it’s an OK transit corridor that could someday become great if the city can figure out a way to add prepaid boarding and/or better enforce the bus lanes.
Steven Vance helped out with data analysis for this piece.
![]()
Did you appreciate this post? Consider making a donation through our PublicGood site.
