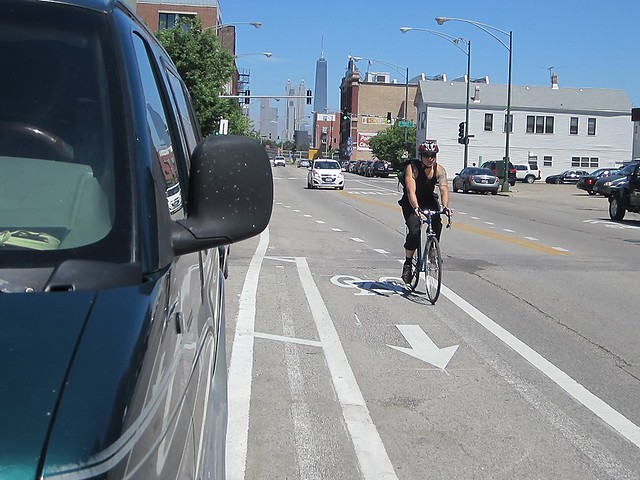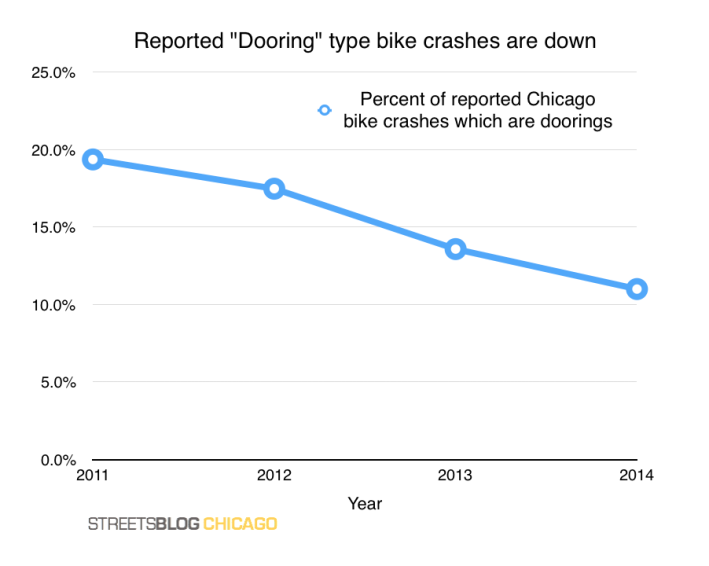
Four years of data on reported dooring crashes in Chicago show a decrease from 2011, when the data started being collected by the state, to 2014, the most recent year for which crash data has been released. A dooring crash occurs when someone in a car opens their door into moving traffic without looking, resulting in a collision with a bicyclist.
The database is maintained by the Illinois Department of Transportation separately from their main crash database, and holds fewer details about each crash, which also makes it more difficult to map.
In 2011, there were 337 reported dooring crashes, comprising 19.4 percent of all reported bike crashes in Chicago that year. In 2014 there were 202 reported dooring crashes, accounting for 11.0 percent of all reported bike crashes in Chicago. That's a decrease of 66.8 percent from 2011 to 2014. See a full table of the data below.
When a person in a car opens a door on a cyclist, the result can be fatal, even if the cyclist never actually makes contact with the door. In recent years several people been seriously injured or killed while biking in Chicago. In 2008 graphic designer Clinton Miceli, 22, was doored by a driver on the 900 block of North LaSalle and run over and killed by a second driver. In 2012 attorney Neill Townshend, 32, swerved to avoid being doored near Oak and Wells and was fatally struck by a truck driver. In 2013 Dustin Valenta, a courier and actor was doored by one driver at 1443 North Milwaukee, then run over by another motorist who fled the scene. This month, a 20-year-old man was critically injured in the same manner in Portage Park.
Dooring and "near dooring" is illegal in Chicago. Section 9-80-035 of the municipal code states, "No person shall open the door of a vehicle on the side available to moving traffic unless and until it is reasonably safe to do so, and can be done without interfering with the movement of other traffic..." In 2013 the city raised the fine for dooring a cyclist from $500 to $1,000.
The large drop in reported dooring crashes could be the result of several factors:
- The installation of protected bike lanes that make it almost impossible to door a cyclist.
- The proliferation of buffered bike lanes, which provide more space for cycling. One study showed that people cycling in buffered bike lanes position themselves slightly further away from the doors of parked cars than those biking in non-buffered lanes.
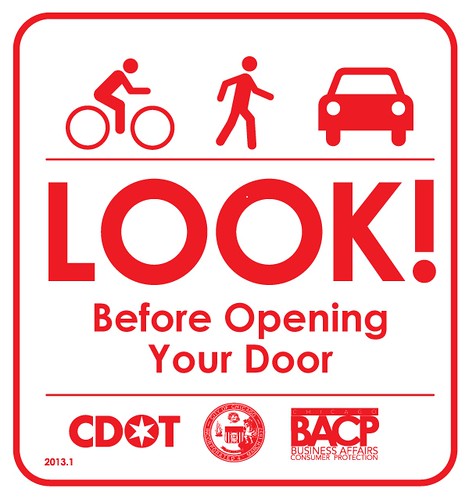
- Better awareness of the issue. While there hasn't been a formal dooring awareness campaign by the city, other than the recent requirement that taxis have "LOOK!" stickers installed in their windows, there have been numerous media reports about dooring crashes.
- The larger dooring fines. Note that the $1,000 fine is more than the penalty for a motorist who causes a non-dooring bike crash.
When I shared this data with Active Trans advocacy director Jim Merrell he responded, "In the absence of a more rigorous analysis, we’d assume this reflects an actual decrease associated with better bike infrastructure and increased awareness among the public."
"We have heard anecdotally that reporting can be inconsistent, so it is certainly possible the decline could be attributable to less reporting," Merrell added. "On the other hand, maybe reporting has increased and the decline in crashes is even bigger! We really just don’t know." Merrell said he hopes more analysis of crash data comes out of the city's Vision Zero process.
I haven't been able to obtain data on the number of citations police officers have issued for dooring crashes. Justin Haugens, a Streetsblog Chicago contributor, has sent Freedom of Information Act (FOIA) requests to the Chicago Police Department, and the Chicago Departments of Transportation, Administrative Hearings, and Finance, as well as the County Court Clerk, IDOT, and the Illinois State Police – all have responded that they don't have that information.
Crash data for 2015 should be available by November.
| Year | Total non-doorings | Total doorings | Total bike crashes | % which are doorings |
|---|---|---|---|---|
2011 | 1,404 | 337 | 1,741 | 19.4% |
2012 | 1,578 | 334 | 1,912 | 17.5% |
2013 | 1,719 | 270 | 1,989 | 13.6% |
2014 | 1,635 | 202 | 1,837 | 11.0% |
This data is provided by IDOT based on crash reports from local police jurisdictions. The department does not endorse or review third-party analyses of its data. Download the data.
