This week, rapid transit headaches in Washington, D.C. and the Bay Area highlighted the need for better maintenance of U.S. public transportation infrastructure. However, a new report from Chicagoland's Regional Transportation Authority suggests that the CTA is in a little better shape than its peers.
On Wednesday, the D.C. Metro system was completely shut down for 24 hours -- with only one day's notice -- so that faulty electrical cables could be replaced.
That evening, San Francisco's Bay Area Rapid Transit system experienced major delays. In an unusual move, a BART spokesman used Twitter to candidly discuss the difficulties of maintaining the system without proper investment.
Yesterday the RTA released its 2014 Sub-Regional Regional Peer Review performance report, which compares the CTA, Metra, and Pace, to transit systems in D.C., Atlanta, Philadelphia, Boston, and New York City. The study found that "overall, the Chicago transit agencies performed well in 2014 in comparison to their peers."
The RTA compared the three local transit agencies to their counterparts in five other cities. The report covers a range of performance measures: ones that affect passenger comfort and trip reliability, as well as the amount of investment in transit each region is making.
The study doesn't make recommendations on how the CTA, Metra, and Pace could improve in these metrics, nor does it compare the kinds of transit investments the six regions are making. It's most useful for understanding how well the agencies are currently operating, and whether or not they might be able to use their existing resources more efficiently. Some metrics, however, can be used to gauge where new resources could help a transit provider improve, but the report doesn't spell these out.
The RTA found that the CTA bus system had the lowest operating cost per passenger mile, the second-lowest operating cost per vehicle revenue hour (the total time that vehicles are transporting passengers), and the second-lowest operating cost per passenger trip. LA's Metro was first in the latter two categories.
The CTA has the second-youngest bus fleet, ranked last in the average number of miles each bus traveled before having a mechanical failure. That might be due the agency's lower-than-average spending on bus maintenance. The RTA noted that the CTA spend 17.9 percent of its bus operating budget on maintenance in 2014, while the five other cities spent an average of 22.5 percent.
The RTA also noted that the recent mid-life overhaul of over 1,000 buses should improve the mechanical performance of the CTA bus fleet. However, back in 2010 the CTA was ranked first in this department, so sixth place is a significant demotion.

CTA bus ridership dropped eight percent from 2013 to 2014, which lowered the number of trips taken relative to the number of service hours. That ratio dropped 6.3 percent, the largest unfavorable change for this measure among its peer group. Local bus ridership fell again in 2015, which is troubling, and the CTA's explanation that weather and Loop construction were a factor doesn't seem to account for all of the ridership loss. On the plus side, the RTA study found that in 2014 the CTA funded a higher percent bus operations via fare box revenue than most of its peers.
Comparing the CTA 'L' with rapid transit lines in the five East Coast cities, the RTA found our trains to rank last in the number of trips made relative to the available service. The report noted that the average passenger capacity on the 'L' rose from 90 to 104 after the newer 5000 series cars were introduced, but the average among the other cities is 172 people. They added:
Smaller cars account for most of the variance in performance, as CTA must run more cars to serve the same number of passengers. SEPTA, which has the second-smallest size rail car, carries nearly twice the passengers per hour that CTA does, but CTA operates 24-hour rail service and has a more extensive network of stations in comparison. When passenger trips are examined in relation to overall capacity rather than per vehicle hour or mile, CTA performs above the peer average, indicating that although its cars are small, they are used effectively.
The CTA runs an efficient rapid transit system. It has the lowest operating cost per passenger mile and the lowest operating cost per vehicle revenue hour, although it has the fourth-best operating cost per passenger trip. The RTA explained that passenger trips on the 'L' are longer than average.
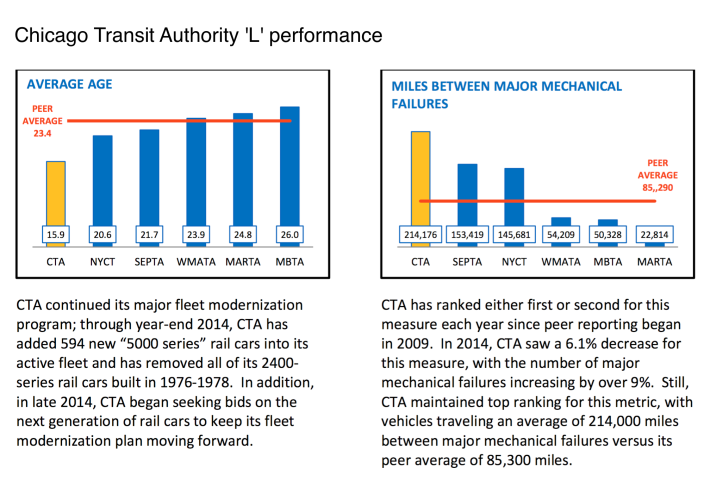
Because the CTA replaced half of its old 'L' cars with the 5000 series cars, the CTA went from having the oldest fleet in 2012 to having the youngest. The fleet will get even younger when 849 new 7000 series cars arrive in 2019. The CTA also maintains their cars well, with each car averaging 214,000 miles before experiencing mechanical failure. The next best was Philadelphia, which got 153,000 miles between failures. The report noted that the CTA spends about the same amount of money on rail car maintenance as the other five systems.
Finally, unlike the CTA bus system, the 'L' doesn't do as good a job as its peers in raising operating funds via fare box revenue. D.C.'s Metro captures nearly twice as much revenue from riders as the CTA and the other four systems, but the report says that's because Metro has zone-based fares and a peak period surcharge. The longer average trip length of 'L' passengers also contributes to the CTA's fifth-place ranking on fare revenues collected per passenger mile. Oddly, the CTA held first place on this metric one year ago.
In 2014, D.C. made a bigger capital investment per passenger trip than CTA, but that didn't prevent the multiple maintenance-related incidents that have plagued the Metro since then, including a smoke inhalation fatality due to a track fire. The CTA's level of investment in the 'L' that year was still higher than New York City's subway, Boston's T, and Philadelphia's mix of light rail and trolley lines.
In a follow up article, I'll discuss the RTA's comparison of Metra's commuter rail operations, and Pace's suburban bus and paratransit systems, with their peer systems in the five East Coast cities.
![]()
Did you appreciate this post? Streetsblog Chicago is currently funded until April 2016. Consider making a donation through our PublicGood site to help ensure we can continue to publish next year.


