Road widths aren’t to blame for Chicago’s racial disparities in speed cam ticketing
Update 7/13/22, 11:15 AM: After publication of this piece, Streetsblog Chicago noticed a couple of minor counting errors in the data analysis – apologies for the oversight. We’ve since triple-checked the data and found our original conclusions still hold: Speed cameras in majority-Black and majority-Latino census tracts are less likely to be located on 4-lane-plus roads than cameras in other census tracts, and most speed cameras in majority-Black tracts are located on streets with only two travel lanes. This post had been updated accordingly. See a full discussion of our methodology at the bottom of this post, and view our data spreadsheet here.
Traffic safety is a pressing issue in Chicago right now. Last year, road fatalities in our city spike to a 174 deaths, reflecting a nationwide trend. And last month, motorists struck and killed four Chicago children.
Meanwhile, on July 20, City Council members will likely vote on a proposed ordinance to raise the speed camera ticketing threshold from the current 6 mph rule to 10 mph. That would essentially legalize driving 39 mph in 30 zones, Chicago’s default speed limit. Federal studies show that while people struck by drivers at 30 mph usually survive, those hit at 39 almost always die.
During the debate over the legislation, Chicagoans have raised valid concerns about the fact that Black and Latino drivers have been recorded breaking traffic laws in our city’s traffic camera zones at higher rates than other motorists. Likewise, there have been troubling findings about the economic impacts for motorists who rack up multiple citations after failing to change their behavior, and accrue ticket debt.
In January of this year, University of Illinois at Chicago researchers released a study of our city’s automated enforcement program, which found the speed cameras prevented 204 injury/fatality crashes from 2015-2017. But the report also identified racial/ethnic and economic disparities in who’s getting photographed speeding and running reds, as well as which Chicagoans are struggling with fines and late fees.
In response to the study’s findings, in April the Lori Lightfoot administration launching the Clear Path ticket equity initative, which goes a long way to address these equity concerns. It offers residents who make less than $41,000 (more for people in larger households) a 50 percent discount on traffic tickets. That means a citation for speeding by 6-9 mph only costs $17.50, or less than three gallons of gas in Chicago nowadays. Clear Path also includes a ticket debt forgiveness program.
These measures undermine election-year arguments by alderpersons that, for the sake of social justice, we must raise the speed camera ticketing threshold to 10 mph. Since recent ticket data shows the 6 mph rule has succeeded in slowing down drivers, allowing 9 mph speeding would almost certainly lead to more traffic deaths.
Taking a closer look at racial/ethnic disparities in automated enforcement
Still it’s important for the city to identify whether there’s anything unfair about traffic camera placement that makes African-American and Latino drivers more likely to get caught breaking traffic laws. The UIC researchers found that “the number of cameras in close proximity to majority-Black or majority-Latino neighborhoods is not significantly greater than other neighborhoods,” which is reassuring.
Last January when the UIC study came out, the news outlet ProPublica ran its own report on Chicago’s automated enforcement equity issues. That piece suffered from a “windshield bias,” mostly just looking at the issue from drivers’ perspectives, but it still included plenty of valuable reporting. This included more details on the racial/ethic disparities in ticketing, plus a discussion of how the built environment may influence who gets traffic tickets.
The ProPublica authors studied camera-recorded traffic violations between 2015 and 2019, and found the cameras recorded 3.1 million incidents of speeding and red light running. 38 percent of those infractions were by drivers from majority-Black ZIP codes, although those areas only contain 27 percent of Chicago households. And 19 percent of the infractions were by motorists from majority-Latino ZIP codes, which contain 16 percent of local households.
Is road width a factor in speed camera ticketing disparities?
The authors provided these thought-provoking statistics:
ProPublica found that all 10 locations with the speed cameras that issued the most tickets for going 11 mph or more over the limit from 2015 through 2019 are on four-lane roads. Six of those locations are in majority-Black census tracts.
Meanwhile, eight of the 10 locations where the fewest tickets were issued are on two-lane streets. And just two of the 10 are in majority-Black census tracts.
In an update on the automated enforcement issue last week, the authors summarized their earlier findings on the built environment: “ProPublica identified some road design and neighborhood-based differences that seem [emphasis added] to contribute to the disparities in ticketing, such as wider streets with more lanes that lend themselves to speeding” in African-American and Latino communities.
After the January ProPublica piece came out, the authors clarified to me that they didn’t actually determine that speed cameras in majority-Black census tracts are more likely to be located on four-lane roads than in other kinds of census tracts, or that speed cams installed in majority-Black census tracts are less likely to be on two-lane roads than in other communities. Therefore, the disparity they identified, that most of the highest-ticketing cameras are located on four-lane roads in African-American neighborhoods, and vice-versa, was not necessarily an inequity.
If it was the case that speed cameras in Black communities are more likely to located be on four-lane roads, while speed cameras in other communities were more likely to be on two-lane roads, that would clearly be unfair.
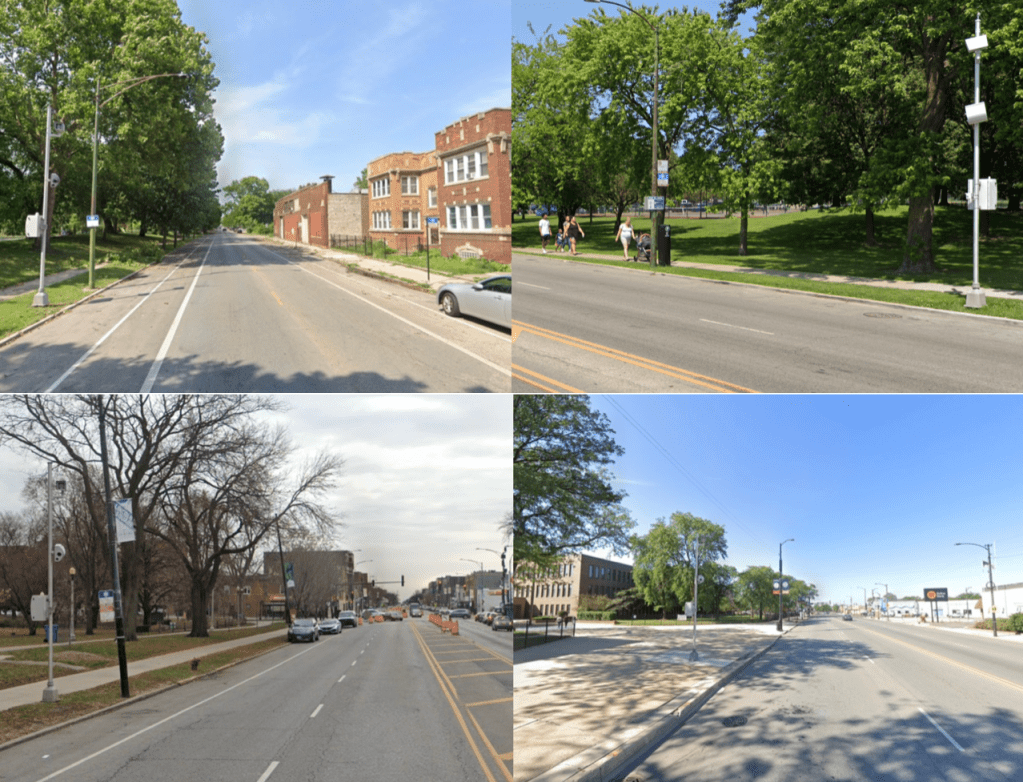
However, a recent analysis of Chicago’s 160 speed camera locations commissioned by Streetsblog revealed that the opposite is true. Most speed cameras in majority-Asian-American, majority-Latino, and majority-non-Hispanic white census tracts are located on roads with four or more travel lanes. But most speed cams in majority-Black census tracts are located on streets with only two lanes. Here’s the breakdown – see more detailed numbers, plus info on methodology, at the bottom of this post.
Speed cameras in majority-Asian-American census tracts
There are three cameras in majority-Asian-American tracts. One camera (33.3 percent) is located on a street with two travel lanes. Two cameras (66.7 percent) are located on streets with four or more travel lanes.
Speed cameras in majority-Black census tracts
There are 47 cameras in majority-Black tracts. 24 cameras (51.1 percent) are located street with two travel lanes. 22 cameras (46.8 percent) are located on streets with four or more travel lanes. (In addition, one camera is located on a street with three travel lanes.)
Speed cameras in majority-Latino census tracts
There are 59 cameras in majority-Latino tracts. 26 cameras (44.1 percent) are located on streets with two travel lanes. 33 cameras (55.9 percent) are located on streets with four or more travel lanes.
Speed cameras in majority-non-Hispanic white census tracts
There are 51 cameras in majority-non-Hispanic white tracts. 17 cameras (33.3 percent) are located street with two travel lanes. 33 cameras (64.7 percent) are located on streets with four or more travel lanes. (In addition, one camera is located on a street with three travel lanes.)
Therefore, while ProPublica recently wrote that “wider streets with more lanes that lend themselves to speeding… seem to contribute to the [racial/ethnic] disparities in ticketing,” the data doesn’t support that theory.
That’s not to say that Chicago’s speed camera placement is absolutely perfect from an equity standpoint. For example, ProPublica’s January article accurately noted that in Black neighborhoods one often encounters fewer people walking, and more vacant lots and industrial zones than in other parts of town. That provides fewer visual cues to encourage drivers to slow down, compared to neighborhoods with more foot traffic, housing density, and retail.
It’s also important to note that factors like occupation, retail deserts, subpar transit access, and personal safety concerns may lead many African-American and Latino residents who drive to spend more time behind the wheel. That could increase their exposure to traffic cameras.
But when it comes to built environment factors that may help explain why Black and Latino drivers are being recorded speeding at more frequent rates than other Chicago motorists, the disparity can’t be blamed on the city unfairly installing more speed cameras on wide roads in those kinds of communities.
Appendix: Methodology and full numbers on speed placement
Steven Field conducted the analysis of 160 speed camera locations for Streetsblog Chicago. He got the addresses and location of each camera from the city of Chicago’s data portal. He used Google Street View to confirm the location of each camera and to count the number of travel lanes. (Two of the 162 cameras shown on the webpage, 1330 W. 76th St. and 4909 N. Cicero Ave., have since been removed, which is indicated on the spreadsheet of data linked at the bottom of this post.)
To find the census tract of each address, Field used the U.S. Census Bureau’s geocoding tool, using data from the 2020 census. He found race/ethnicity demographics for each census tract by using these tables provided by the Census Bureau to search this document: 2020: DEC Redistricting Data (PL 94-171).
Here are the full numbers.
160 total speed cameras
2,746,388 total Chicago residents
Asian-American – 6.6 percent of Chicago population
- Total number of cameras located in majority-Asian-American census tracts – 3
- Cameras on roads with 2 travel lanes – 1
- Cameras on roads with 3 travel lanes – 0
- Cameras on roads with 4 travel lanes – 2
- Cameras on roads with 6 travel lanes – 0
Black – 29.6 percent of Chicago population
- Total number of cameras located in majority-Black census tracts – 47
- Cameras on roads with 2 travel lanes – 24
- Cameras on roads with 3 travel lanes – 1
- Cameras on roads with 4 travel lanes – 22
- Cameras on roads with 6 travel lanes – 0
Latino – 28.8 percent of Chicago population
- Total number of cameras located in majority-Latino census tracts – 59
- Cameras on roads with 2 travel lanes – 26
- Cameras on roads with 3 travel lanes – 0
- Cameras on roads with 4 travel lanes – 29
- Cameras on roads with 6 travel lanes – 4
Non-Hispanic White – 33.3 percent of Chicago population
- Total number of cameras located in majority-non-Hispanic white census tracts – 51
- Cameras on roads with 2 travel lanes – 17
- Cameras on roads with 3 travel lanes – 1
- Cameras on roads with 4 travel lanes – 31
- Cameras on roads with 6 travel lanes – 2

Read More:
Streetsblog has migrated to a new comment system. New commenters can register directly in the comments section of any article. Returning commenters: your previous comments and display name have been preserved, but you'll need to reclaim your account by clicking "Forgot your password?" on the sign-in form, entering your email, and following the verification link to set a new password — this is required because passwords could not be carried over during the migration. For questions, contact tips@streetsblog.org.