Since early in the COVID-19 pandemic, the Chicago Loop Alliance has been publishing monthly reports that track physical and economic activity downtown, including pedestrian counts, CTA and Metra ridership, parking volumes, and occupancy of hotels and office buildings. Now, with over 20 months of data, the jagged lines on the CLA report have become a fair indicator of the collective mood during a public health crisis that has dragged on longer than anyone expected. The theme of the January 2022 report mirrors conversations I’ve had over the last six weeks, along the lines of, “Omicron is really disheartening but, hey, we’re better off than we were this time last winter.”
From the start of the COVID crisis in March 2020, most of the lines on the CLA recovery report rise gradually and steadily, with a bump in the summer of 2021, when Covid infection rates were low and vaccines widely available. A blue, vertical line on the chart running through the lowest point of Covid infections marks when the city entered Phase 5 of recovery and activity in the Loop took a notable uptick.
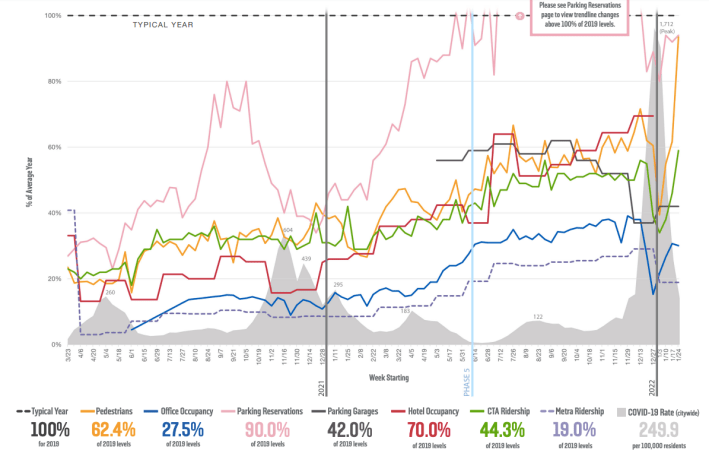
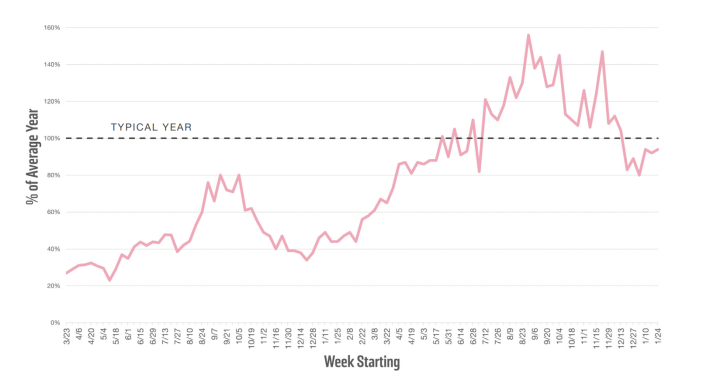
One outlier – and the theme of these posts for the last year – is the alarmingly high volume of parking reservations on surface streets and lots. Throughout the pandemic, many Chicagoans avoided trains and buses (even though studies have found the risk of COVID spread on transit is relatively low), causing the volume of parking downtown to be significantly higher than all other indicators. Parking quite literally shot off the chart in the summer, reaching a peak of 156 percent of a “typical” pre-pandemic year last September. It finally fell below 100 percent of the 2019 baseline ("Typical Year") in December, although that was likely tied to the same sharp decline in office occupancy, when the highly infectious Omicron variant caused a massive spike in cases, delayed and/or reversed return-to-office plans, and smacked what had been an encouraging improvement on almost all metrics down a good 20 percentage points.
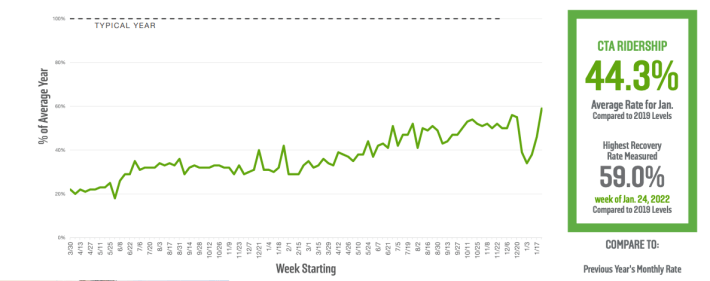
The numbers bounced back quickly as Omicron subsided. However, a record high pedestrian count at the end of January – 93 percent of the benchmark – is due to the polar vortex that took place the same week in 2019 when temperatures dipped to -14F, making the black dotted “typical year” line in January anything but typical. CTA ridership similarly rebounded, up to 59 percent of 2019 numbers, also no doubt inflated by the extreme cold the same week of the comparison year.
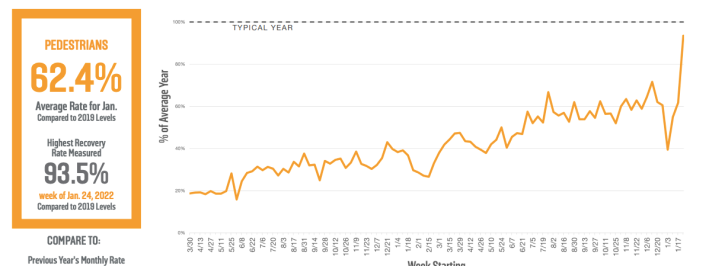
But still, 2019 was the standard for last January’s CLA report too, when the pedestrian count and CTA ridership were around 30 percent of the benchmark. To adjust for the weather anomaly, the current CLA report provides an average pedestrian rate last month of 62 percent—nearly double that of January 2021. CTA fared less well, with an average rate of 44 percent in January, 17 points higher than the previous year.
It's good to see improvement, even incremental improvement, but as COVID restrictions ease it is crucial that transit agencies, employers and the city make public transportation the safest, most convenient, and most affordable option for travel downtown.
