Last Friday the city of Chicago announced the publication of anonymized trip info from apps for ride-hailing companies, including Uber, Lyft, and Via, on its Data Portal. To protect the privacy of drivers and customers, the starting and ending locations were lumped together by Census tract. Let's take a look at some of the interesting takeaways from the data that's currently posted on the portal, covering November and December 2018.
Downtown trips
The most common ride-hailing trip made during that two-month period was taking a short ride from the Census tract that includes the western part of the River North neighborhood (let's call it River North West) to the one that includes the west side of the Loop proper (we'll call it Loop West.) 29,262 such trips were made during the two-month period.
The combined length of these two tracts is only about a mile and a half, and the most frequently occurring trip length was 1.1 miles. That's a short distance to drive in a car, so many of these trips could have easily been made by walking or biking. On the other hand Chicago weather can get pretty nasty during those months, and the bikeway connections between the two zones aren't the greatest.
A person tweeting from the @ChicagoBars Twitter feed speculated that many of these trips may be made by hotel, restaurant, and bar patrons and employees who are concerned about personal security while traveling late at night. However, the vast majority of these trips – a little over 80 percent – started in River North West between 7:00 a.m. and 7:59 p.m.
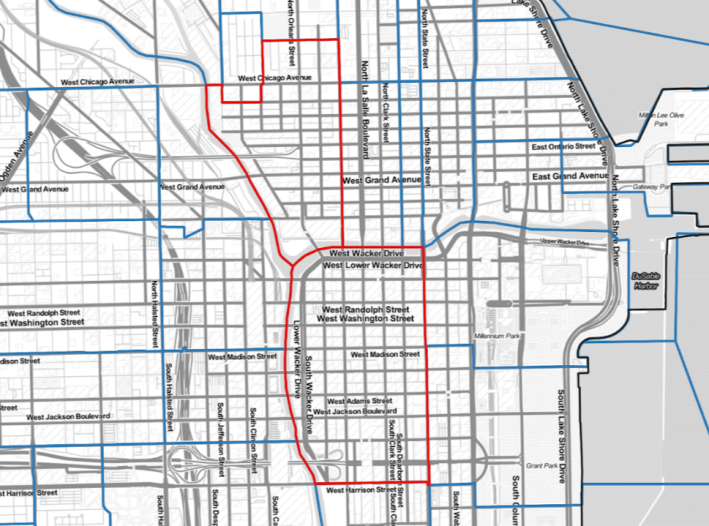
The total number of trips originating from River North West was 341,582. So the 29,262 trips made to Loop West represented only 8.6 percent of trips from River North West.
The second most common trip was from the Loop West tract to O'Hare Airport, with 27,308 trips. However, the inbound trip from O'Hare to Loop West was only the 15th most popular type of trip, with 20,147 rides.
The third most common trip was from the Census tract that includes the northeast quadrant of the Loop proper (let's call that Loop Northeast) to Loop West, with 27,151 trips. That also includes some very short trips, with possible starting points and destinations including office buildings, high-rise housing, hotels, and tourist attractions.
Altogether, 645,087 rides were taken into the Loop West tract. Since November and December represent 61 days, that's an average of 10,575 trips per day.
One negative impact of all these short trips in a transit-rich part of town is that the additional driving causes more congestion and slows down CTA buses. That's why Chicago should charge an additional tax on trips into and out of the Loop and other dense areas, and invest the revenue in improving CTA service, something mayor-elect Lori Lightfoot has voiced support for.
Looking at weekdays only, 24,596 trips were made from River North West into Loop West during the two-month period. That comes out to an average of 572 trips per weekday. Weekday trips represented 84.1 percent of trips between River North West and the Loop, more evidence that this kind of trip is largely done for workday commutes.
The most common distance of all Chicago ride-hailing trips during the two-month period was 1.2 miles. Again, that's a really short distance to cover on bike or electric scooter (if Chicago had them.) Even on foot, that would only take 24 minutes to walk at a 3 mph pace.
Low-income areas
Of course, ride-hailing use isn't just confined to toney downtown districts – people in low-income areas also use it. (For our purposes, we'll use the Chicago Metropolitan Agency for Planning's definition of "low-income areas" as ones with an average household income at or below 60 percent of the Chicago Metropolitan Statistical Area's median income, currently $35,580 for an individual, and $50,760 per year for a family of four.)
However, most low-income Census tracts saw fewer than 5,000 trips start there during the two-month period. The average number of trips originating in low-income areas was 3,305. The median is much lower than the average, at 1,281. This means that half of the low-income Census tracts originated fewer than 1,281 trips in November and December.
In contrast, the average number of trips originating in non-low-income Census tracts was 24,394. The median number of trips was 3,124, suggesting that a disproportionate number of rides originate in a small number of non-low-income tracts.
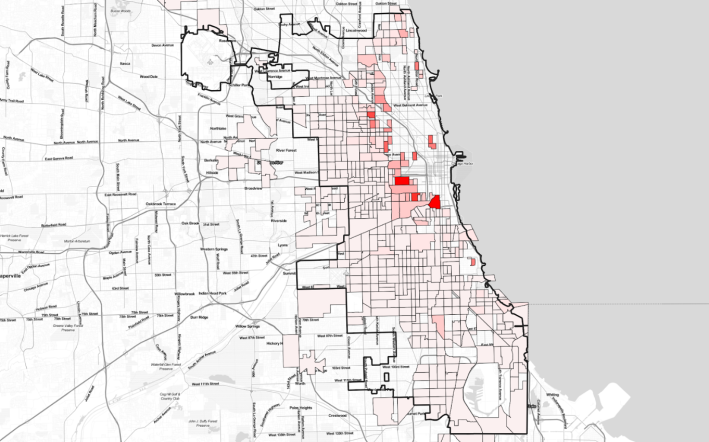
The low-income Census tract that generated the most ride-hailing trips includes the Illinois Medical District, with 52,659 total rides during the two-month period. Most trips that started in the IMD were headed to the Loop West tract, even though the Blue and Pink lines offer a cheap alternative for making the same trip.
The second most popular destination for rides originating in the IMD was the West Loop Census tract that includes Union Station. Again, the Blue Line could have been an option for that trip.
The low-income area that generated the second-highest number of riding-hailing trips was the tract that includes Chinatown and part of Armour Square. Once again, the most common type of trip was to Loop West, with 3,736 rides. That's despite the presence of the Red Line and bus routes on State Street and Archer Avenue.
Next steps
Studies have shown that ride-hailing is increasing congestion in cities like Chicago. The new ride-hailing data adds to the wealth of transportation statistics that the city of Chicago has been making available. This new info could be compared to the taxi trip data to get a sense of how many ride-hailing trips are replacing trips by taxi and other modes.
The CTA should analyze the ride-share data as it provides more insight on the kind of trips people are taking. The transit agency might be able to access the specific pickup and drop-off points and to determine if there's an unmet need for better transit options.
Have you checked out the ride-hailing data yet? If so what patterns have you noticed? Let us know in the comments.
