Englewood Divvy Use Is 3X Higher Than DNAinfo Reported, But It’s Still Low
An article posted this morning by DNAinfo reporter Andrea V. Watson includes some interesting interviews with people in Englewood, a low-to-moderate-income, about why they think the community’s five Divvy stations are getting relatively little use. Their explanations ranged from spread-out destinations to concerns about safety.
There was also a good quote from Oboi Reed of Slow Roll Chicago, which has been contracted by the city to do outreach for the Divvy for Everyone equity program. He noted that encouraging residents to make short trips by bike can boost retail sales in struggling communities. “More retail attracts more short-trip activity, more short-trip activity attracts more retail, and in turn we create more jobs, more eyes and bodies on the street,” he said.
It wasn’t surprising to hear that Divvy ridership is off to a slow start in Englewood. When I visited stations in the neighborhood last May, soon after the local stations were installed, almost all the passers-by I spoke with were unclear on how bike-share works, although many of them expressed interest in trying it.
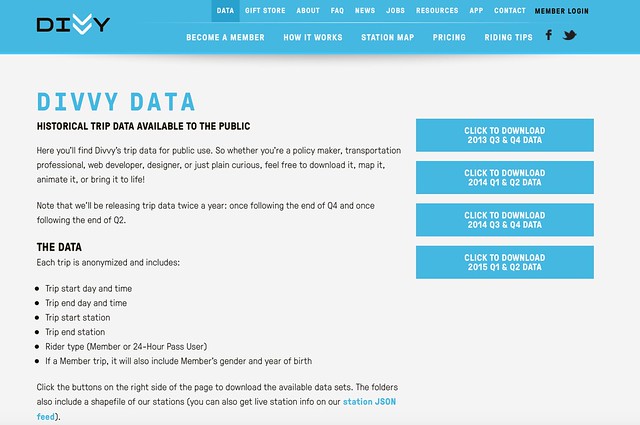
However, I was surprised by just how low DNA’s ridership numbers were for the Englewood stations. The figures came from a DNA data analysis of 2015 Divvy ridership. “We crunched and mapped all 2.5 million rides taken in the last year on the sky blue cycles,” Watson’s colleague Tanveer Ali stated in an article about the analysis posted on Monday. Here are number of trips taken this year in Englewood, according to DNA:
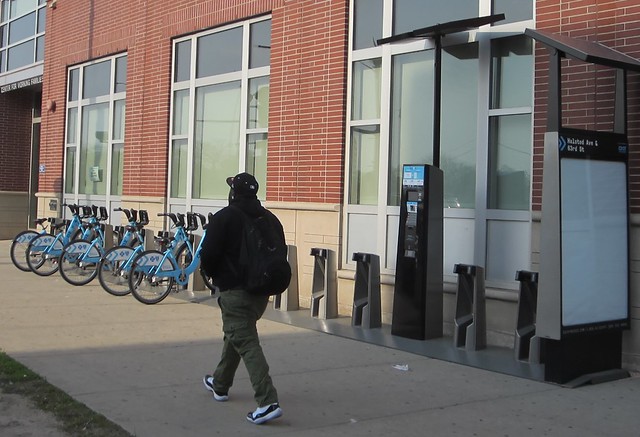
- 63rd and Halsted: 87 rides
- 69th and Halsted: 61 rides
- 61st and Eberhart: 48 rides
- 69th and Perry: 49 rides
- 56th and Halsted: 22 rides
It was hard to believe that only 267 trips have been taken on the five stations since they opened last spring, so I contacted Divvy and the Chicago Department of Transportation to double check the figures. According to CDOT, these are the correct figures for April through September:
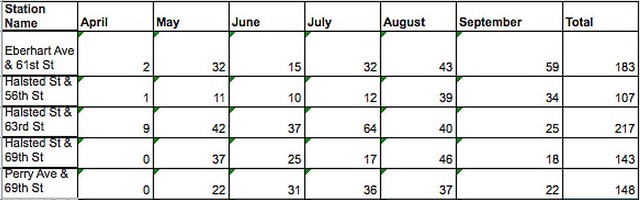
So the actual total number of trips taken this year on the five Englewood stations was 798. That’s about three times the number of rides DNA reported.
So why was their count so low? “Their numbers must have been through end of June, from our publicly available data,” said Divvy general manager Elliot Greenberger. The ridership numbers for the first two quarters of 2015, plus the previous two years, are available on the Divvy website. “They hadn’t asked for any further numbers,” he said. CDOT spokesman Mike Claffey added that the department would be happy to provide the most recent ridership data.
Since it appears DNA was using outdated ridership numbers for Englewood, it’s likely that other articles they published this week about trip data for the entire city, Uptown, and Logan Square are also based on old data. It would be great if they overhaul those posts to reflect the most recent information.
DNA’s outdated numbers for Englewood also means that there was yet another piece of misinformation in the anti-bike screed columnist Mark Konkol published this week. He claimed that the majority of bike lanes installed under the Emanuel administration went to wealthy parts of Chicago, when the opposite is true.
Konkol also stated that “the hardly used stations in Englewood average a ride or two per month.” Now we know that the five stations actually averaged about 32 rides per month from April to September. Moreover, none of the stations opened before April 15, and the station at Perry and 69th wasn’t installed until May 7, according to CDOT.
Still, these Englewood ridership numbers are much lower than many other stations in Chicago, which average hundreds or thousands of trips per month. The outdated DNA data aside, a more important question is, what can be done to increase Divvy use in the neighborhood?
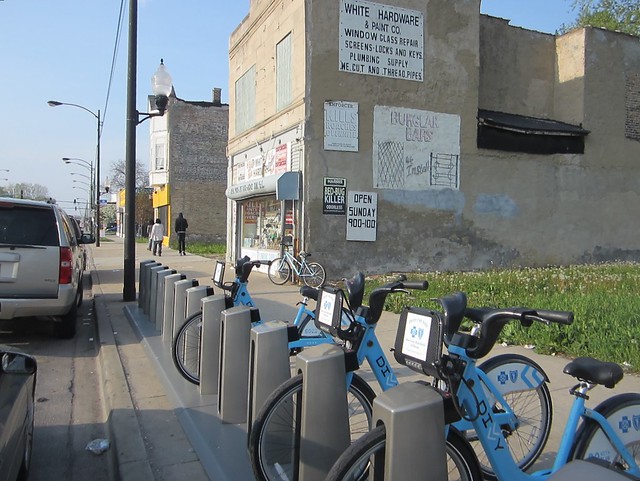
Englewood has decent bikeway coverage, with long, fairly continuous, stretches of bike lanes on Halsted Street, Damen Avenue, and Marquette Road. However, the fact that the neighborhood lies on the outer edge of the bike-share service area, and stations are generally spaced a half-mile from each other, rather than the quarter-mile spacing found in denser parts of the city, limits the usefulness of the stations. And while the $75-a-year membership fee is a bargain, it has been a barrier for many residents of this low-to-moderate income community.
However, Claffey noted that the above chart shows a slow-but-steady rise in the use of these five stations. He added that he’s optimistic that the Divvy for Everyone (D4E) initiative will help build ridership in Englewood and other LMI communities. The program offers $5 annual memberships to low-income Chicagoans, and waives the usual credit card requirement. More than 1,000 people have signed up since the initiative launched on July 7.
Outreach by Slow Roll and the city’s Bicycling Ambassadors will help spread the word about the usefulness of the bike-share. And the city is considering adding more South Side stations in the future, which could provide more destinations to ride to from the Englewood stations. With these factors in play, hopefully local Divvy ridership will begin to grow at a faster pace.
Update: Watson’s story has been edited to include the following text:
All of these stations saw more usage in July through September — usually Divvy’s most popular months, based data on covering dates after DNAinfo’s initial citywide analysis. The Halsted and 56th station had 85 total rides during these three months, nearly four times higher than in the months preceding it.
The DNA piece has also been updated to reflect the fact that the ridership data originally used for the piece only included trips taken by June 30. In addition, they’ve updated their original list of ridership numbers for the stations, which was based on April-June data, by adding the April-September figures in parenthesis.
According to CDOT’s Mike Claffey, the department reached out to DNA to provide the recent data. “We just wanted them to have better numbers,” Claffey said.

Read More:
Streetsblog has migrated to a new comment system. New commenters can register directly in the comments section of any article. Returning commenters: your previous comments and display name have been preserved, but you'll need to reclaim your account by clicking "Forgot your password?" on the sign-in form, entering your email, and following the verification link to set a new password — this is required because passwords could not be carried over during the migration. For questions, contact tips@streetsblog.org.