Three months ago, on the morning of July 24, I observed the intersection of Dearborn Street and Washington Street to collect data on bicycle traffic on Dearborn’s two-way protected bicycle lane, keeping track of factors like bicyclists' gender and helmet use rates. Last Thursday during the morning rush I returned to the bi-directional bikeway to observe it from another vantage point, in order to gather more information about Chicago’s bike culture.
This time, I stationed myself one block north of the previous observation site, on the second floor of a McDonald’s at the northeast corner Dearborn and Randolph. This elevated perspective allowed me to collect video footage. I aimed the camera at the intersection’s northwest corner. I was interested in observing the number of bicyclists during this two-hour period, what direction they were riding, how they dealt with the stoplight, interactions between cyclists and pedestrians, the cyclists' riding postures, and the types of bikes they rode.
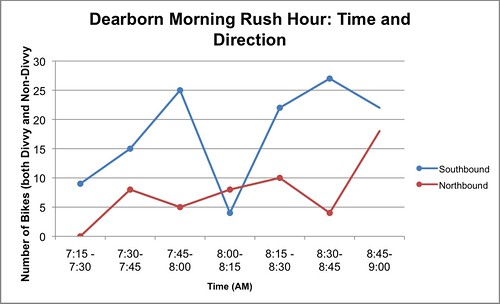
As you can see from the above graph, southbound ridership generally far exceeded northbound ridership. The total number of riders was 195.
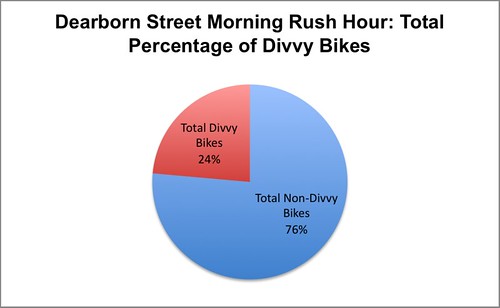
The percentage of people on Divvy bikes has tripled since July. During the July count, Divvy riders made up eight percent of the total. On Thursday they made up 24 percent of the bike traffic. As bike-share expands, it’s clear more and more Chicagoans are using Divvy for commuting and errands.
This time, I was also interested in how traffic signals affect bicycle riders. Because my camera was focused on the northeast corner of the intersection, I only kept track of southbound bicyclists, observing how cyclists who stopped at red lights prepared for the light to turn green.
Did they wait behind the stop line until the light actually changed, or did they start pedaling past the stop line shortly before the light change in preparation? Among cyclists stopped at the red, 71 percent did not move until the light turned green. The remaining 29 percent used a variety of tactics to get ready for the green. For example, after coming to a full stop, some scooted or slowly pedaled across the stop line and past the crosswalk, in some cases timing it perfectly to coincide with the light change.
In some bike-friendly countries like Denmark, where I recently lived for a year, the traffic signal sequence moves from green to yellow to red to yellow and back to green. Cyclists usually start rolling again during the second yellow light, so that they reach the intersection as the light turns green. Some Chicago cyclists behave in a similar way by beginning to move again when the opposing traffic signal turns red, but before their signal turns green, or by moving when a leading pedestrian interval walk signal is activated.
Dearborn could be modified to optimize traffic flow for cyclists. Just like the leading ped interval signals, the dedicated bike signals could be timed to turn green before the stoplight for cars does. Visual and/or auditory cues, such as a countdown signal, could also be added to the bike stoplights to help cyclists prepare for the light change. Better yet, the signals could be synchronized so that people pedaling at a given speed, say 12 mph, could enjoy a series of green lights, making biking a more practical and pleasant way to commute. In Denmark, this light synchronization is known as the “Green Wave,” and some American cities have implemented it on streets with high bike volumes, like San Francisco's Valencia Street.
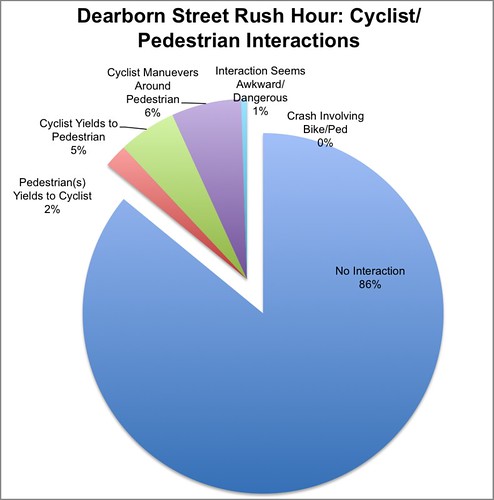
Given my own experiences along Dearborn, I expected to see more interactions between cyclists and pedestrians. Instead, 86 percent of cyclists had no interaction with pedestrians on the curb or in crosswalks. I defined an interaction as people maneuvering around or yielding to each other in order to avoid conflicts. During the entire observation period, I observed only one scenario that I would describe as a close call, where a pedestrian jogged through the bike lanes. There was no contact.
Cyclists maneuvered around and yielded to pedestrians (six percent of the cyclists I observed and five percent, respectively) more often than pedestrians maneuvered around and yielded to cyclists (two percent of the cyclists I observed). Planners must recognize potential conflict sites involving bikes and pedestrians and try to mitigate them. For example, the text “Look Bikes” plus arrows marked in both directions on the pavement in the crosswalks on Dearborn are intended to warn pedestrians to watch out for bi-drectional bike traffic.
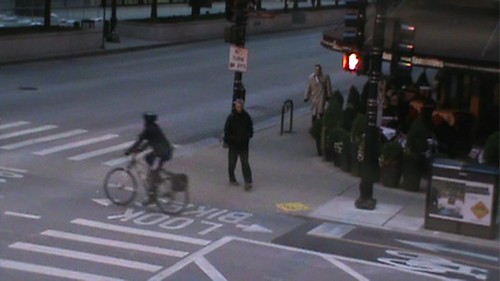
The last two data points I observed involved Dearborn users’ riding habits. The most common riding posture is the 45-degree back bend shown in the screen capture below. The rider illustrates the midway point along a scale of one to five, with “one” being the most upright posture, like on a Dutch bike, and “five” representing a racing-style posture, bent over on drop handlebars. The most upright position came in second, with 30 percent of riders – many of these were Divvy users.
Road bikes made up 56 percent of all the bicycles I observed at the intersection. Divvy bikes came in second at 24 percent, hybrid bikes came in third at 10 percent. Dutch-style bikes, including those with step-through as well as diamond frames, came in fourth at five percent. Four percent of the bikes I saw were mountain bikes, and the last one percent were other styles. Despite the road bike’s dominance, the variety of bicycle types and rider postures shows that there is a diversity of riding styles on Chicago’s streets.
Do you also like to keep track of Dearborn data? If so, keep your eyes on the street and let us know what trends you spot in the comments section.

