By Brandon McFadden
Brandon McFadden works as a cyber security analyst. In his spare time, he volunteers with the grassroots transit advocacy group Commuters Take Action, providing the data for the daily tweets and helping to organize campaigns.
While the CTA still hasn’t published a press release schedule changes, it has uploaded updated timetables for the rail routes.
This time last year the CTA published its first schedule reductions in recent history. According to updates of the General Transit Feed Specification published by the agency on Monday showing an effective date of October 8, and as Commuters Take Action predicted last month, the news is not encouraging. The CTA has once again slashed schedules, with an average reduction of 60 trips on Weekday, Saturday, and Sunday schedules respectively. These reductions again set an agency record with a disheartening 24 percent overall reduction compared to pre-pandemic schedules.
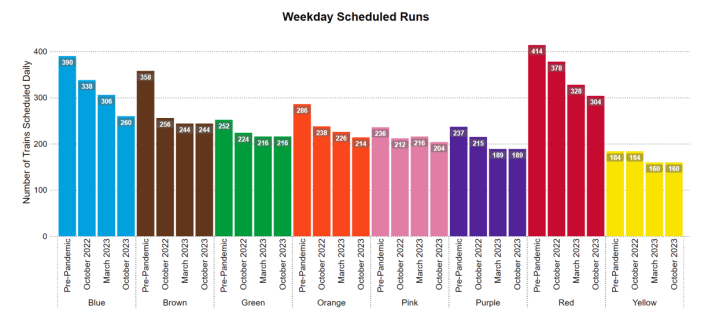
A graph showing the total number of trips daily for the pre-pandemic schedules and 3 subsequent schedule changes.
Keeping in mind that each trip removed results in longer wait times, this is what riders can expect from these new schedules compared to March 2023.
Green, Purple, and Yellow Lines:
- Green, Purple, and Yellow lines have no notable schedule changes, remaining reduced by approximately 12 percent each.
Blue Line

A graph showing the number of Blue line trains scheduled Forest Park bound over the course of a weekday.
- Peak Period
- There was no notable improvement to the number of trains scheduled per hour for the weekday peak period, which the CTA defines as 7 a.m. to 9 a.m. and 4 p.m. to 6 p.m. Subsequently, the overcrowding issues experienced by riders will persist.
- Weekday
- The O’Hare branch lost 46 daily trips across the off-peak hours, in most cases doubling rider wait times.
- The Forest Park branch gained 40 daily trips, providing much needed balance to the branch and leveling wait times across the line.
- Weekend
- Saturday and Sunday schedules lost nearly 50 trips each.
- On Sundays, trains are scheduled at 15-minute intervals, a far cry from six minute intervals pre-pandemic.
- Moreover, according to the schedule, there are no longer UIC-Halsted short turns, providing additional capacity to Forest Park branch riders.
Brown Line
- Brown line weekday schedules have no notable changes.
- Saturday schedules lost 1 train per hour during the early morning and late-night service periods, totaling 9 for the day and an increase from 12 to 15 minutes for wait times.
- Sunday schedules lost one trip in the final service hour further increasing wait times for late night riders.
Orange and Pink Line
- Orange and Pink line riders lost 12 daily trips respectively in the evening peak period. As a result, riders can expect scheduled service intervals to increase from 9 to 12 minutes.

A graph showing the number of Red line trains scheduled 95th bound over the course of a weekday.
Red Line
- Reduction of 24 total trains on weekdays, with Saturday and Sunday schedules remaining stagnant.
- These weekday reductions are spread across the mid-day period, bringing scheduled wait times from 7.5 to 10 minutes during the period.
Even with the multiple schedule reductions over the last 12 months, the variability in arrival headways, or the gap between trains, has hardly improved. When comparing September 2022 and 2023 we only see an increase of 9 percent. Only 73 percent of September 2023 trips had consistent headways while the remainder arrived erratically, either traveling in bunches or after a large gap. This is why an increase of just a few minutes in scheduled wait time is detrimental. When a trip is canceled it leaves riders stuck waiting even longer.

A graph showing the percentage of trains that arrive at consistent intervals. A higher percentage indicates a more consistent operation.
Since the announcement of the CTA’s “Meeting the Moment” plan, the agency has regularly highlighted an increase in service delivery percentages. While this metric has increased, it is only the result of reductions of the scheduled trains. To no surprise, the agency is running the same number of trains as last year. With the CTA only changing the denominator and praising the outcome, it is treating those reliant on the system like fools.
In communicating its schedule changes, CTA has been very careful to avoid the term “service cuts.” Instead, through carefully crafted newspeak, it tells the public about “schedule optimizations.” One day, we hope to have a CTA that is straightforward to the public, and more importantly their riders. Until then, Commuters Take Action has assumed that role. We compiled comprehensive service cut statistics on our website for both bus and rail schedules. While publishing such data would be effortless for the CTA themselves, it deliberately chooses not to do it.
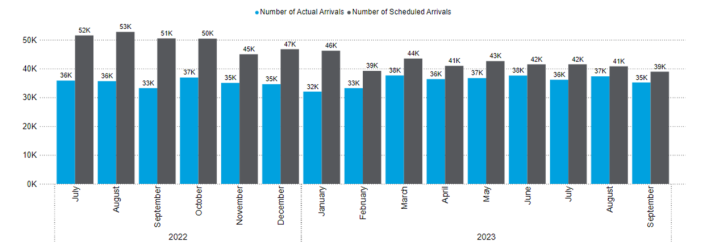
A graph showing the number of train trips completed compared to the number of trips scheduled.
While schedule reductions are not ideal, without an increase in workforce they are the only way to improve the percentage of service delivered. Despite the CTA boasting about their “robust hiring,” rail operator headcount remains stagnant compared to a year ago. As of August 2023, the agency reported a rail operator headcount of 722 of the budgeted 839 — 2 less than September of last year.
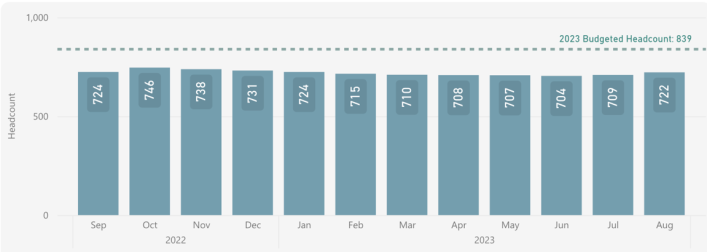
A graph from the CTA's Performance Dashboard showing the number of active rail operators. Image: CTA
Of course, this stagnation in rail operators is not surprising. With the exception of a single press release in April 2023, there is no easily accessible information for candidates interested in becoming a rail operator with the CTA. In contrast, New York’s MTA has an entire webpage dedicated to outlining the process. Irrespective of the perception of operator safety at the CTA, without providing an outline of the pathway to becoming a rail operator there is no way to attract additional talent, especially those external to the agency.
The agency's repeated cuts, resulting in a 24 percent overall reduction from pre-pandemic schedules, have left us with increased wait times yet only a marginal increase in service quality. In reality, the improvements in service delivery percentages presented by the agency are only a consequence of the reduced schedules rather than actual improvements in service. With compounding reductions in schedule being the only change over the last 12 months, we can’t see any other way out of this crisis without a significant change in leadership.
Despite all of these issues, the CTA continues to paint its poor service as a part of a nationwide problem. However, this isn't a nationwide problem. It's not even a local problem.
While Metra and Pace have had their own hurdles to jump over, they took action early on in the pandemic. Both agencies adjusted or reduced schedules early and operated smaller fleets. As ridership recovery has continued, they have increased frequency or added new service in line with the changing dynamic in ridership trends.
But the CTA is an agency stuck in old habits, taking orders only from its president. Dorval Carter’s CTA isn’t “meeting the moment.” It's time to transition from "Dorval Carter's CTA" and embrace the era of "The People’s CTA."
Brandon’s CTA Rail Reliability Tracker is available here. You can follow Commuters Take Action on Twitter, Instagram or visit ctaction.org.

Did you appreciate this post? Please consider making a tax-deductible donation.
