The Chicago Loop Alliance, which has been tracking activity downtown since the start of the COVID-19 pandemic, just released its December 2021 recovery report. Streetsblog has been following CLA’s reports for over a year, and this month there’s comparatively good news, okay news and – due to surging coronavirus infection rates starting in late December – hard-to-interpret news.
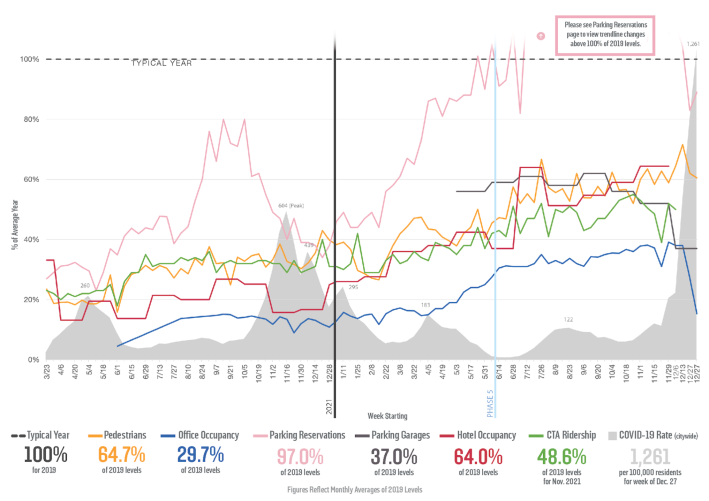
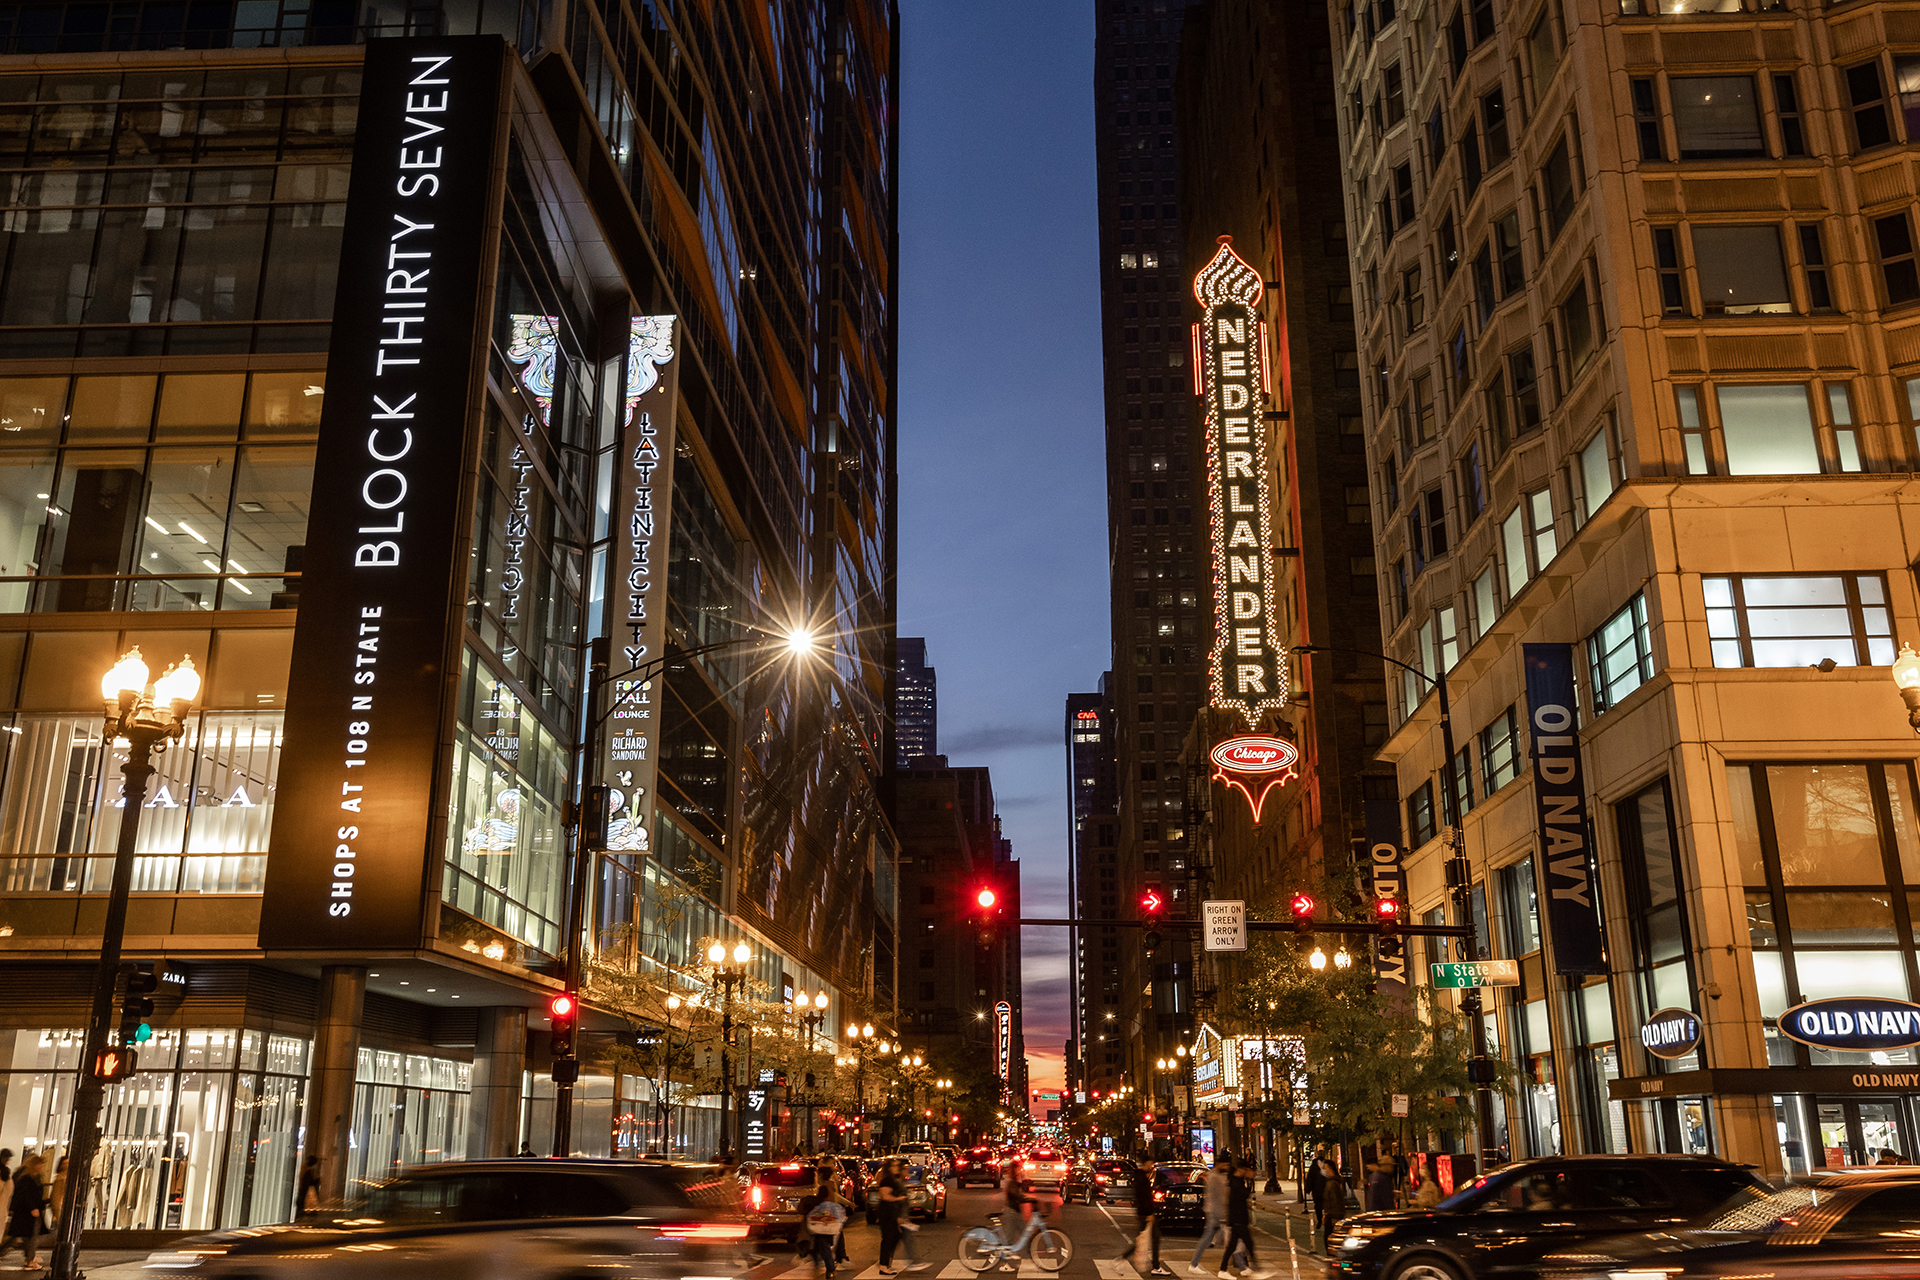
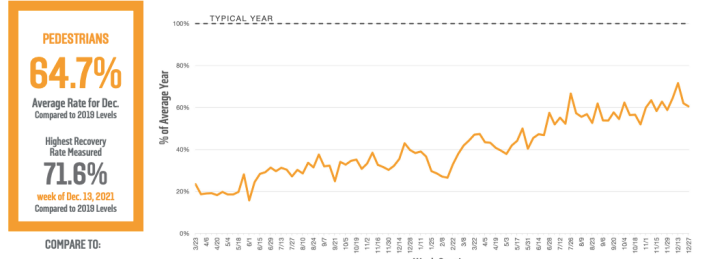
Let’s start with the good news. The number of pedestrians downtown in December – tracked by a series of counters situated along State Street – hit its highest point since the beginning of the pandemic, an encouraging 65 percent of the amount of foot traffic compared to the same dates in 2019. In the report, CLA president Michael Edwards credited holiday attractions like the Millennium Park Christmas tree and the Christkindlmarket as magnets for visitors to the Loop. This theory is backed by hotel occupancy numbers, which also rose steadily, breaking 60 percent of a “typical” year.
Even more encouraging is that this bump in foot traffic was not accompanied by an increase of driving. Astronomical parking reservation levels, which had been the only metric higher than its before-times benchmark, had remained higher than normal for six months, and had been the distressing theme of these posts for the last year. However, that disturbing trend has finally eased, with the number of parking reservations dipping below pre-pandemic averages in the last two weeks of 2021.
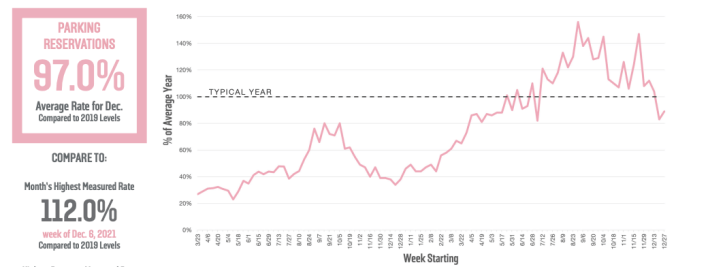
While that’s a great sign that holiday visitors seemed to be taking more sustainable modes to the Loop, we shouldn’t breathe too easy just yet. The dip in parking paralleled an expected drop in office occupancy rates around the winter holidays. Parking numbers will likely spike again when workers, even a fraction of those normally in downtown offices, return to part- or full-time in-person work.
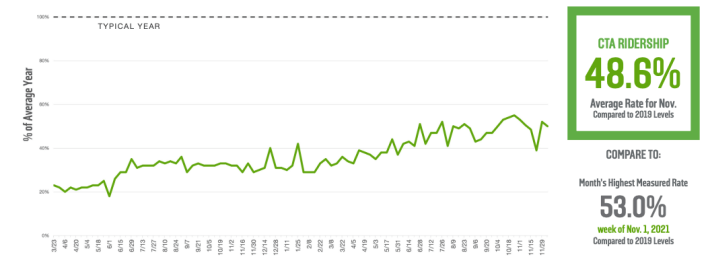
For the okay news, see CTA ridership data, which is reported a month behind other metrics. After about a 10 percent increase in the spring, ridership recovery continues to be sluggish at best, bumping along below 60 percent of 2019 levels. Of course, it could be worse: the CTA line is continuing to rise, just very, very gradually.
Overshadowing this report is an actual shadow, showing how Covid-19 positivity rates stack against the recovery metrics. The shading is jagged mountain range with peaks in the cold months and happy valleys in the summers. At the righthand edge of the graph, where the most recent end-of-year data is reported, a thin streak of gray shoots to the heavens, indicating the arrival of the fast-spreading Omicron variant. The massive spike of cases throws into question what these trend lines will look like going into 2022. It will be interesting to see how many people travel downtown for work, school, shopping, and entertainment in the coming months, and how they get there.
