Since September, Streetsblog has been following monthly economic recovery reports issued by the Chicago Loop Alliance, which aggregate data from pedestrian counters; office building, hotel and parking spot occupancy; and Loop Alliance member surveys to track how many people are coming to the Loop for work and recreation during the pandemic, and how they’re getting there.
This month, the report included two new illuminating data points: CTA ridership and COVID-19 positivity rates. These lines were added to a year-over-year chart that compares the percentage of office and hotel occupancies, parking rates, CTA ridership and pedestrian counts to the same time the prior year. While , of course, COVID-19 positivity rates can't be compared to the prior year, since the pandemic wasn't a thing in 2019, placing these numbers against the other lines illustrates the impact surges in the pandemic have had on business activities and transportation in the Loop.
At the beginning of the shutdown in mid-March, all activity plummeted and remained low throughout the first wave of the pandemic, until about the end of May. When positivity rates subsided in the summer, office and hotel occupancy slightly increased. Pedestrian activity and CTA ridership, which traced an almost identical path, saw a somewhat higher recovery through June. Parking rates, on the other hand, quadrupled by late summer, spiking to 80 percent of the same time last year, and suggesting car traffic rates might soon exceed pre-pandemic levels.
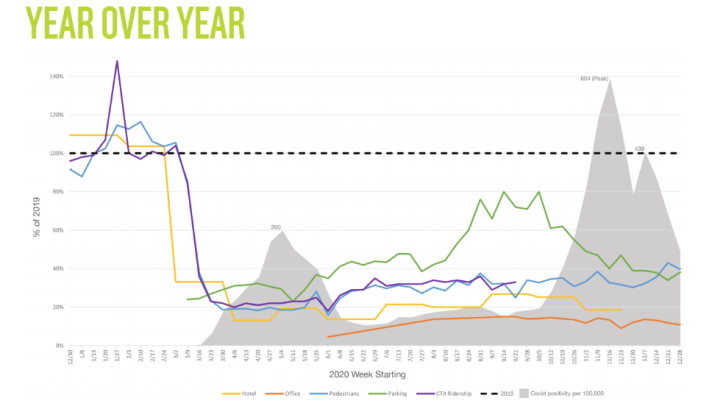
In October, the second wave of the virus struck hard, with positivity rates dwarfing March figures. More stringent measures were taken to slow the spread, including a state ban on indoor restaurant and bar service. This correlated with a second decline in hotel occupancy rates and another dip in office occupancy which, due to many white-collar jobs going remote, has yet to exceed 20 percent of the same time the prior year. Parking rates sloped steeply downward again and continued to decline in December.
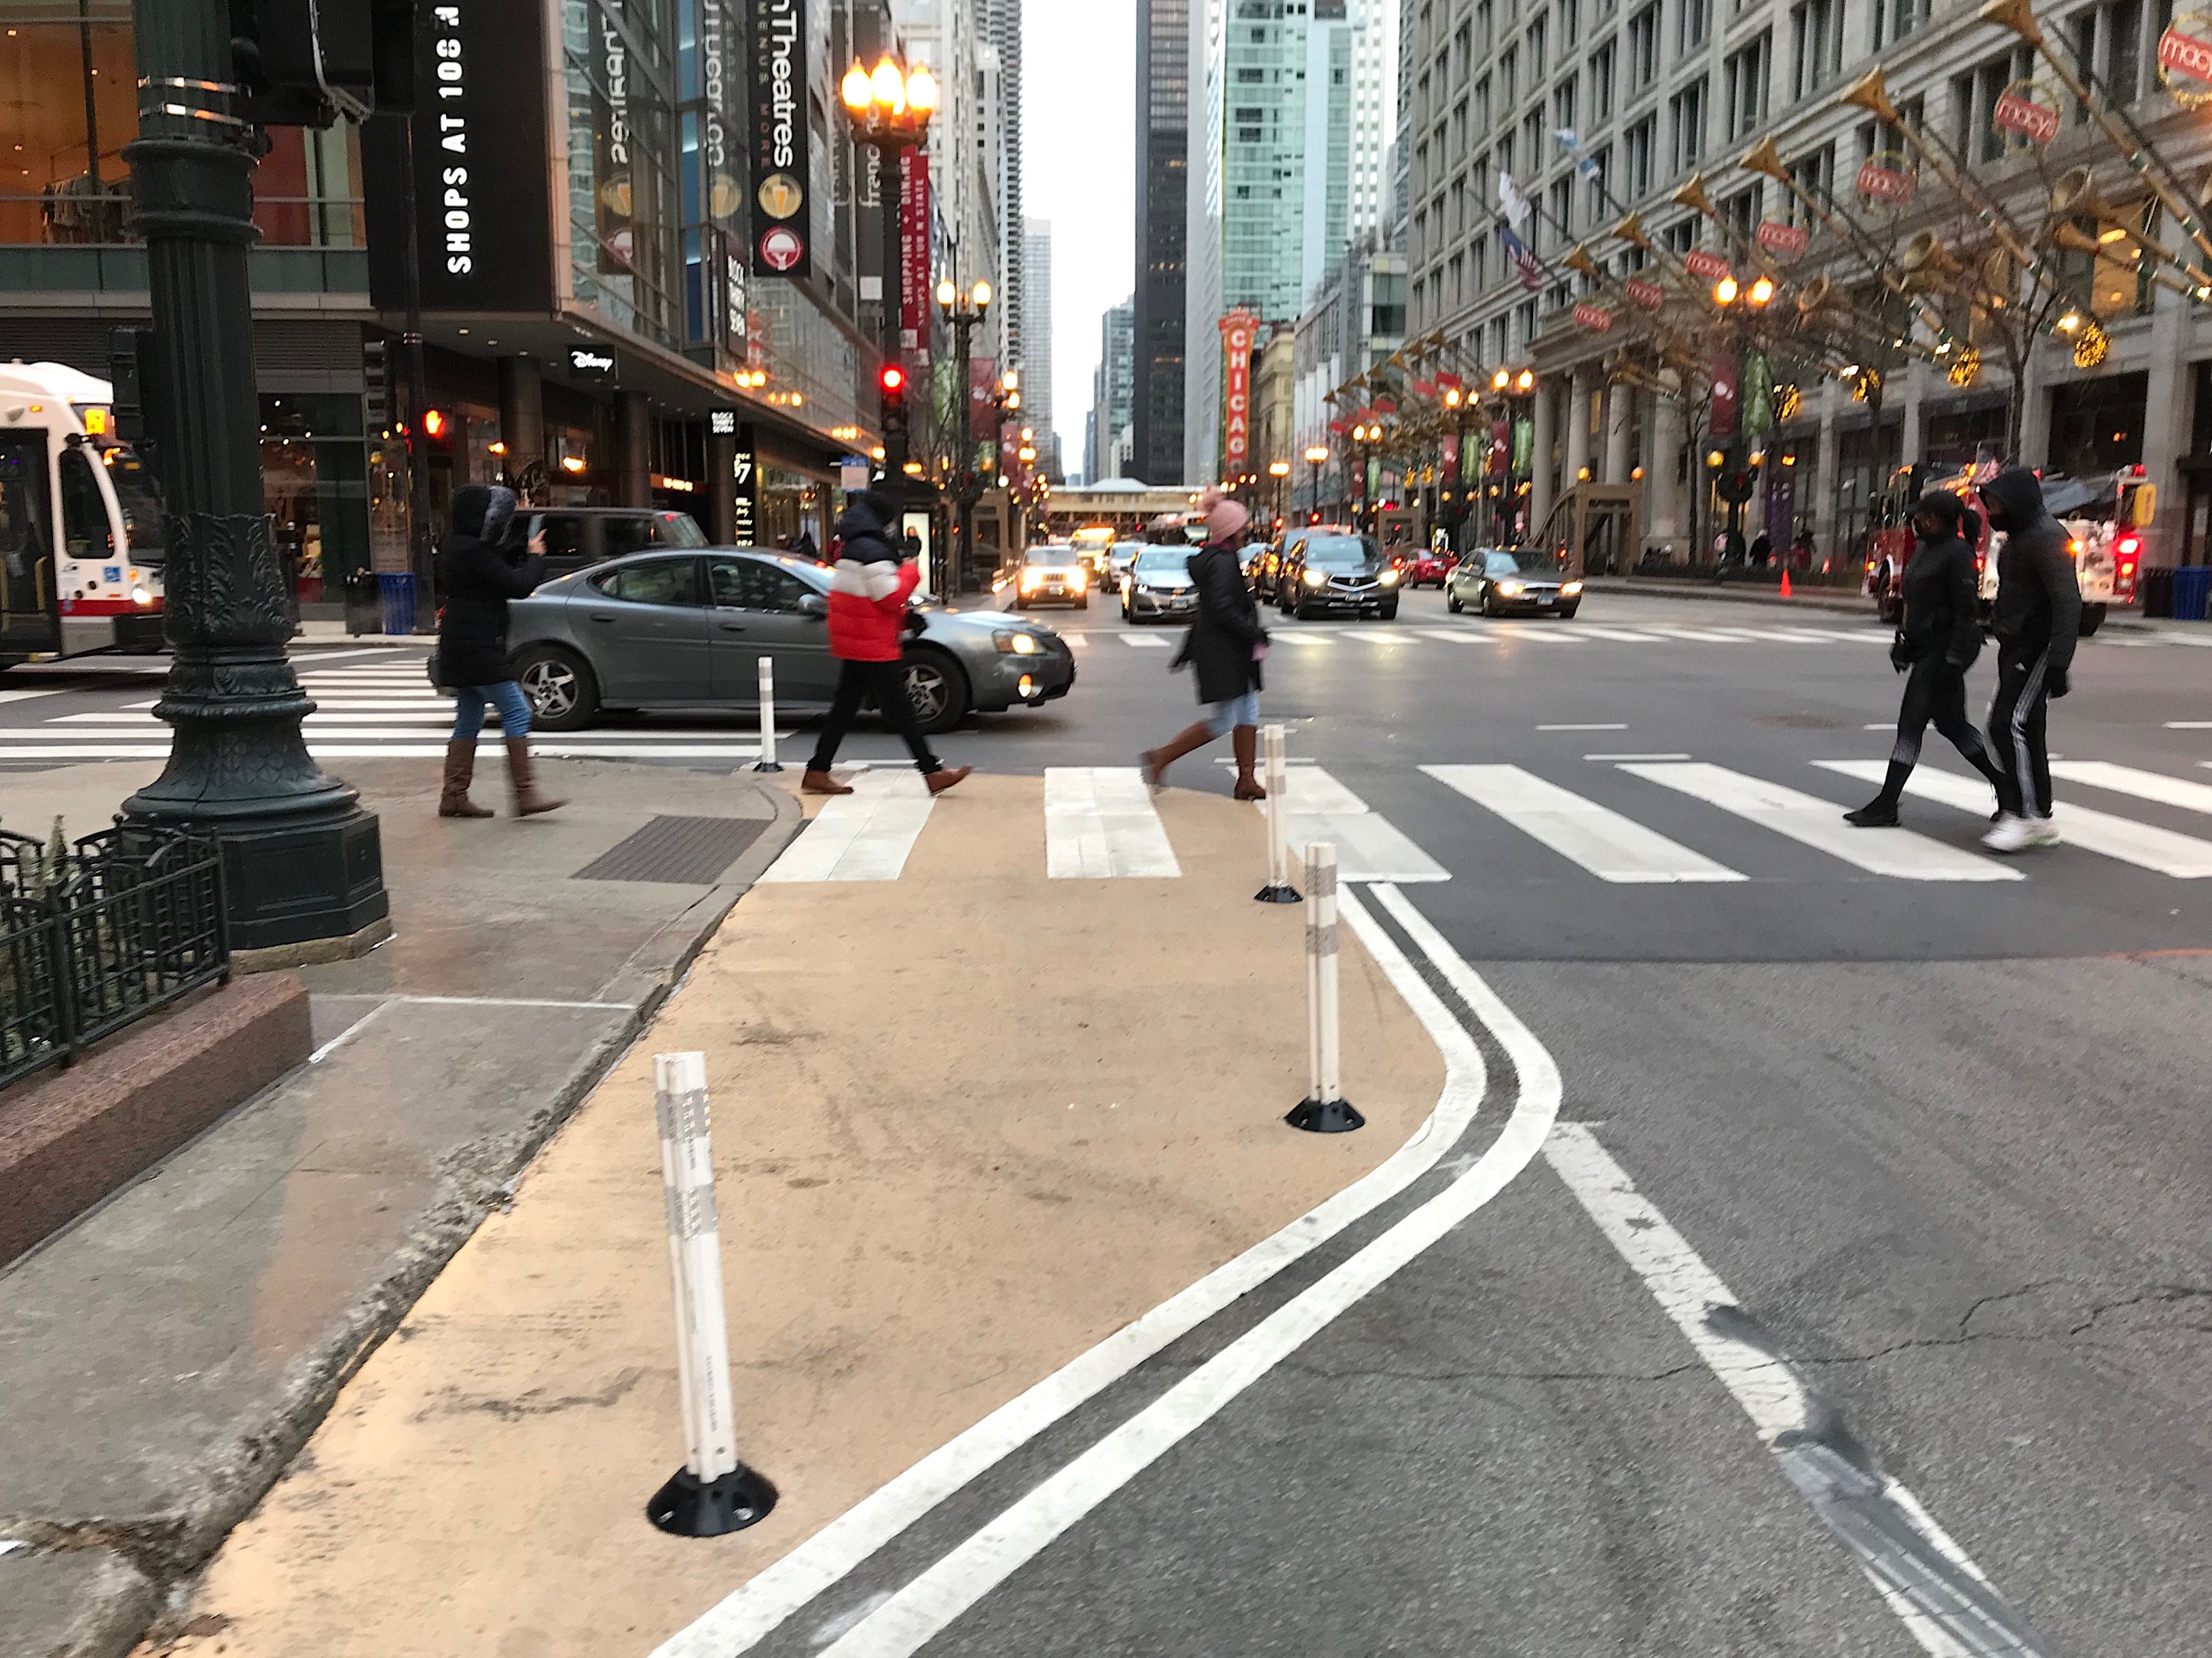
Interestingly, pedestrian rates increased through the holiday season, surpassing parking rates in the second week of December. Over 50 percent of survey respondents said they visited the Loop during the weekend in December, up from 38 percent the prior month, and by far the most since the beginning of the pandemic. Respondents who said they traveled to the Loop to go shopping also increased from 35 percent in November to over 50 percent in December, suggesting holiday shopping and festivities—however limited—still drew people downtown.
CTA ridership data is only reported through mid-September (the high-water mark of the parking surge) but the increase in pedestrians and decrease in parking rates likely indicate that many folks traveling downtown for holiday-related activities arrived via CTA trains and buses.
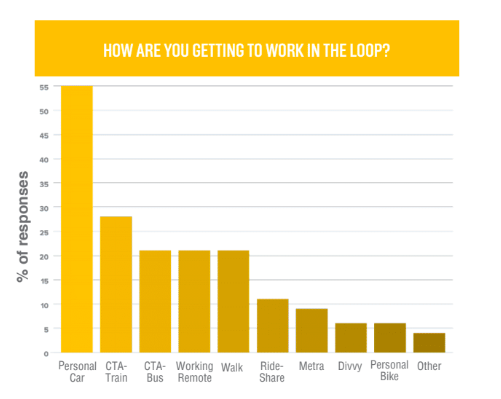
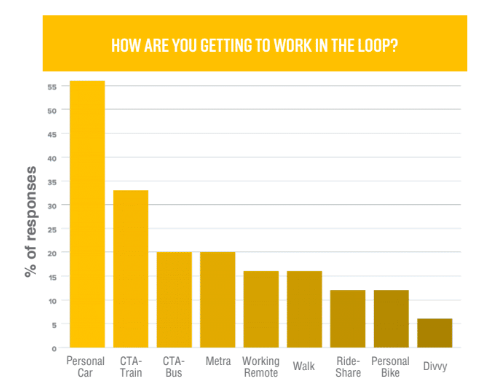
Driving, however, remained the most popular mode of commute. Over 55 percent of respondents said they used their personal car to get to work in December. CTA 'L' and Metra ridership both increased from the prior month, with CTA use increasing from about 25 percent to roughly 35 percent of respondents, and Metra more than doubling, jumping from under 10 percent to 20 percent of respondents. Personal bicycle commuting also doubled, from 5 percent to 10 percent of respondents.
While the continued, if gradual, return to CTA and Metra commuting is an encouraging trend, enticing car owners to leave their vehicles at home and commute by foot, bicycle, and public transportation once businesses begin to reopen on a larger scale will be a challenging. Chicago should encourage sustainable commutes through safe, convenient transit, including striping pop-up bus lanes downtown, and building more protected bike lanes in the Loop.
