Mapped: Where Most Chicagoans Don’t Own Cars
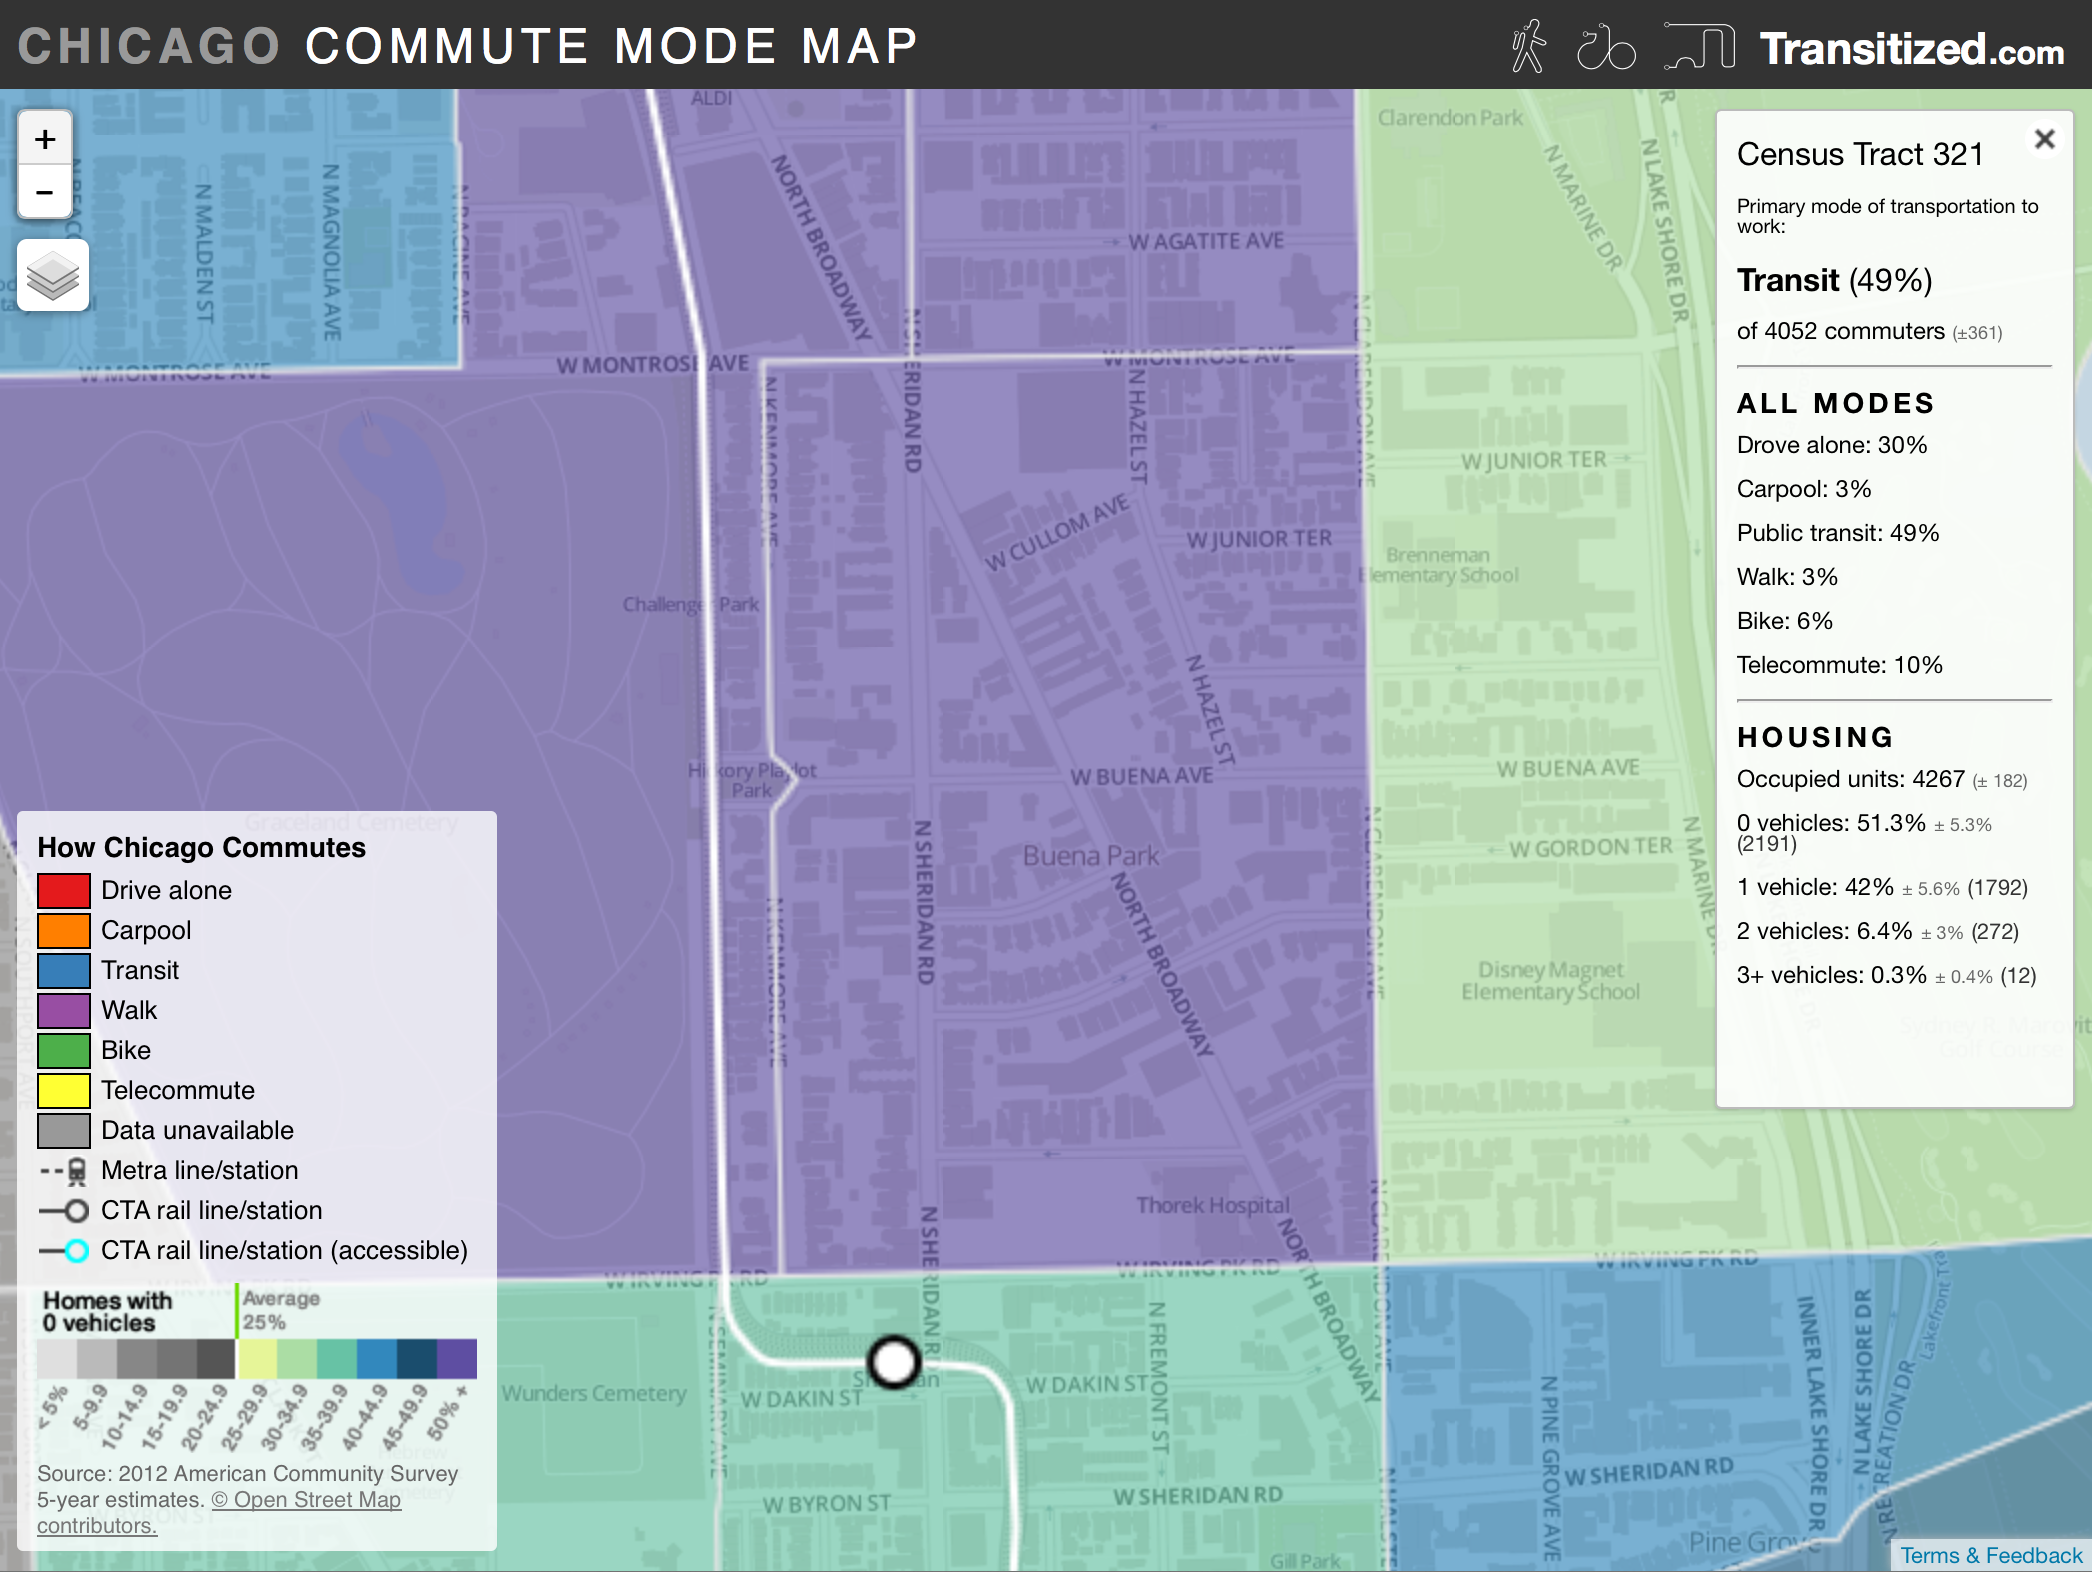
A new interactive map shows what transportation mode people use to get to work in each neighborhood in Chicago, while also identifying the share of Chicagoans who don’t own cars. Shaun Jacobsen — who writes the Transitized blog and occasionally freelances for Streetsblog — created “How Chicago Commutes” to show that many residents will benefit more from walking, bicycling, and transit improvements than free curbside parking, which tends to dominate the discussion at public meetings.
Jacobsen created the map last week. The first iteration showed the primary commute mode for each census tract using data collected from 2008 to 2012. On Monday he published an update, and the map now also shows how many households don’t own cars. I recently caught up with him to learn more about the underlying data and how he expects people will use it. Here’s our interview.
Why did you create the Chicago commute map?
Last year, planning Participatory Budgeting projects for the 46th Ward, we looked at Broadway south of Montrose but determined that no bike lanes could be installed without removing parking spaces because it’s too narrow. We dismissed the idea because of the hot button issue parking is.
Now looking at the map, you see that half of the occupied housing units within a block of that stretch don’t have any cars at all. So why can’t even 25 percent of the street — one lane of parking — be removed to make room for a project like that? These are the kind of things I hope people think about now that the data is online and available at the tract level.
What myth are you trying to dispel?
The myth that most people own cars and we can’t take away the space for them. In the specific example of Broadway, if 50 percent (with a margin of error of ±5 percent) of homes have no cars at all, then that argument doesn’t hold up. I hope this will give people easy access to census data so these sorts of myths can be counter argued.
You recently updated the map. What did you change?
I added additional layers that can give people a better idea of how people are commuting in all modes across the city. The original map really only showed two things: where people who drive to work live, and where people who take transit to work live. Now you’ll be able to select each mode and see where those areas are.
For example, click on the “Bike” layer and you’ll see darker green along Milwaukee Avenue. There are more people living in that area that commute by bike. The original map showed this, but only if you hovered over each tract and looked at all of the numbers.

I also created a new map that shows where homes with zero vehicles are. [Access this data by clicking on the layers button in the top left corner of the map.] Everything that’s grey is below the city’s “car free” average of 25 percent. The lighter the grey, the more homes have cars. The colored tracts are where the number of car-free homes is higher than average. Purple means more than half the homes in the tract have no cars. I made this map because I think it’s very helpful in demonstrating that there are a lot of homes with no cars in the city.
How do you think people should use the map?
I really hope people use this not only just to waste a few minutes at work, but to print out or share online when it comes to planning decisions in their neighborhood. In my case, we’re going to have some meetings coming up in the 46th Ward about new bike infrastructure. If I can show that at least 40 percent of people living along the planned bike corridors are car-free, it might make a stronger case for removing space for parked cars in favor of an alternative like bike lanes, or to make the pedestrian space safer.

Read More:
Streetsblog has migrated to a new comment system. New commenters can register directly in the comments section of any article. Returning commenters: your previous comments and display name have been preserved, but you'll need to reclaim your account by clicking "Forgot your password?" on the sign-in form, entering your email, and following the verification link to set a new password — this is required because passwords could not be carried over during the migration. For questions, contact tips@streetsblog.org.