
In its first weekend of operation, Divvy bike-share saw 4,123 trips. Annual members accounted for 78 percent of the trips from Friday to Sunday, with the rest coming from people who purchased 24-hour passes (which cost $7). The five most popular starting stations were all downtown and near the lakefront and coincided with the five most popular destination stations, just in a different order. They were:
- Michigan Ave & Oak St
- McClurg Ct & Illinois St
- Lake Shore Dr & Monroe St
- Millennium Park
- Wabash Ave & Roosevelt Rd
Last night at the weekly Open Government Hack Night, Scott Kubly of the transportation department and Daniel Gohlke of Divvy spoke to tech experts (and coders in training) about the public data available about the bike-share system.
Divvy's website offers a real-time feed of bike and dock availability to app programmers, and an API was developed over the weekend by Hack Night member Ian Dees to make it easier to access this data. Divvy has an online map with markers that tell how many bikes and docks are available, and it has a smartphone app called CycleFinder (Android, iPhone). With the real-time data feed, coders can now take the API and create their own applications with it.
So what will programmers be able to work with? The new transit system will create an abundance of data, and everything "that's not tied to a specific user" will be open, Kubly said. And Gohlke added that Alta Bicycle Share, Divvy's operator, typically releases anonymized trip data quarterly.
The purposes of this data can be broken down into two categories: planning and monitoring. This information could be used to measure the effect of new bike lanes or inform where new bike lanes should be added. As for monitoring, the data could be used to see which stations get the most use, or to optimize the redistribution of bicycles in the system so that stations don't get completely depleted or completely filled with bikes.
Kubly said the department is looking for a way to predict when a station will be full or empty. This would help in Divvy's rebalancing efforts, and could give staff the information they need to pre-emptively stock a station before an onslaught of riders comes looking for bikes.
Other potential uses that were suggested at the meeting:
- Tracking stations that are out of service
- Figuring out which bikes break down most often
- Calculating the optimal route to chain trips, so users can reach destinations without exceeding the 30-minute time limit and incurring overage fees
- Mapping rebalancing by checking which bikes are removed from stations by staff keys, then tracking that bike's ID to its recipient station
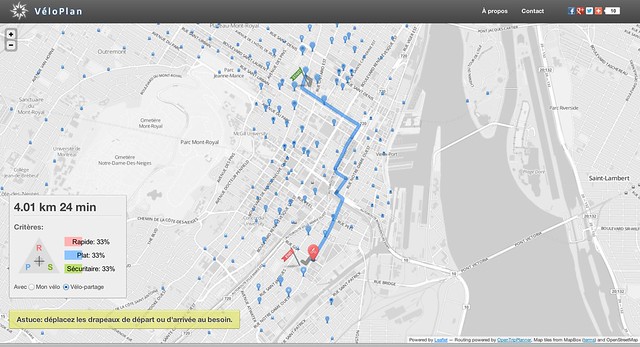
- Trip routing, like Veloplan.net, that tells you where to pick up a Divvy and drop one off, taking into account bike and dock availability
- Distinguishing between trips taken by tourists and non-tourists
Interested data analysts and programmers should take a look at this collaborative document generated from last night's discussion, which also contains links to existing applications, analyses, and visualizations from bike-share systems in other cities. The coolest visualization is an animation of Divvy activity over the last two days that shows how people cruised around Chicago on the blue bikes.