Digging Into Dearborn Data: Patterns and Behavior on the Two-Way Bike Lane
Guest contributor Kristen Maddox recently spent a year in Copenhagen as a Fulbright fellow and worked with Copenhagenize Design Company. Now back in the US, she is actively looking for work in bicycle planning and advocacy.
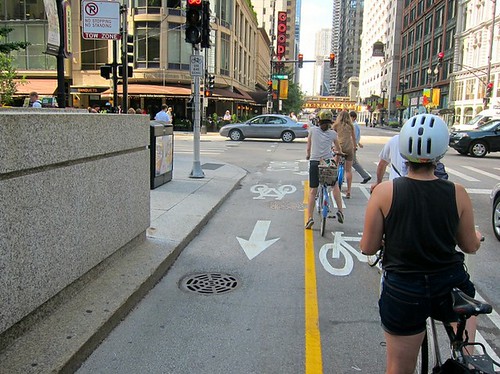
Dearborn Street’s two-way protected bike lanes are equipped with 16 micro-radar sensors with four wireless access points so traffic data can be accessed in “real-time” via cloud-based storage. These technological features make it easy to measure the amount of bike traffic and red-light compliance by bicyclists. Compliance has increased from only 31 percent of cyclists stopping for reds before the lanes and bike-specific traffic signals were installed, to 81 percent afterwards. To determine what other data can be culled from the Dearborn lanes and what this says about the future of cycling in Chicago, I recently performed a much lower-tech study of the facility.

I made my observations at Dearborn and Washington Street during morning rush hour on Wednesday July 24th. Given the limited observation period, the results should be taken with a grain of salt. Nonetheless, they suggest that much can be learned from analyzing other intersections across the city, including those currently without bicycle facilities. My inspiration for this investigation came from a study entitled Desire Lines: The Bicycle Choreography of an Urban Intersection, released by Copenhagenize Design Company earlier this year, and feedback from Zach Vanderkooy from the Green Lane Project.
During the two-hour observation period, I kept track of the following:
- Total number of cyclists and male/female ratio
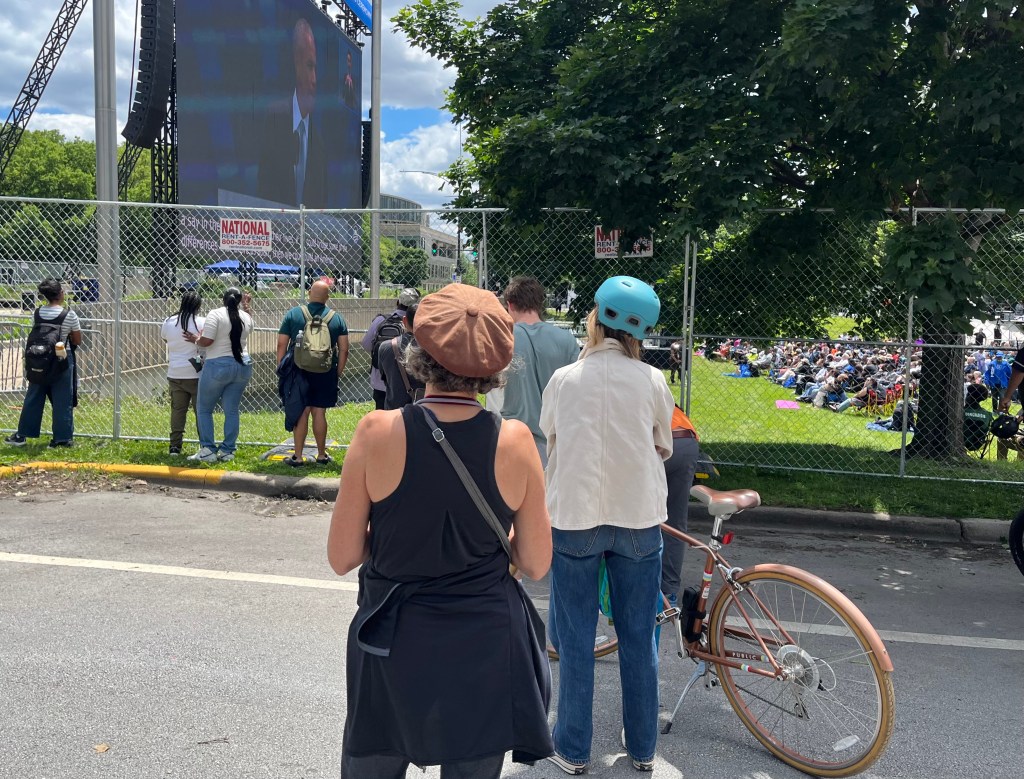
- Helmet use
- Use of the left-turn box
- Number of cyclists choosing to ride outside of the protected lanes
- Use of non-standard bikes, types other than single-person road, mountain, hybrid, etc.
- Number of cyclists carrying cargo (I’ll explain the reason for this later)
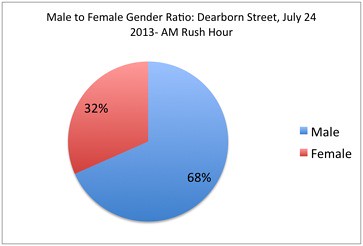
The first two items serve as points of reference for understanding Chicago’s burgeoning bicycle culture. In European cities with a high bicycle mode share, helmet use is very low because cycling is not viewed as a dangerous activity. Unlike in most U.S. cities, ridership among women and men is nearly equal. In the Netherlands and Denmark, more women than men ride, whereas in most other countries around the world, most cyclists are male. For an in-depth look at the gender issue read Balance on the Bike: An Essay on the Relationship Between Gender and Cycling by Ma. Fernanda Porras, Claire Stoscheck, and Angela van der Kloof. The gender breakdown of the cyclists I saw at Dearborn/Washington that morning was 32 percent women and 68 percent men (266 men and 123 women).
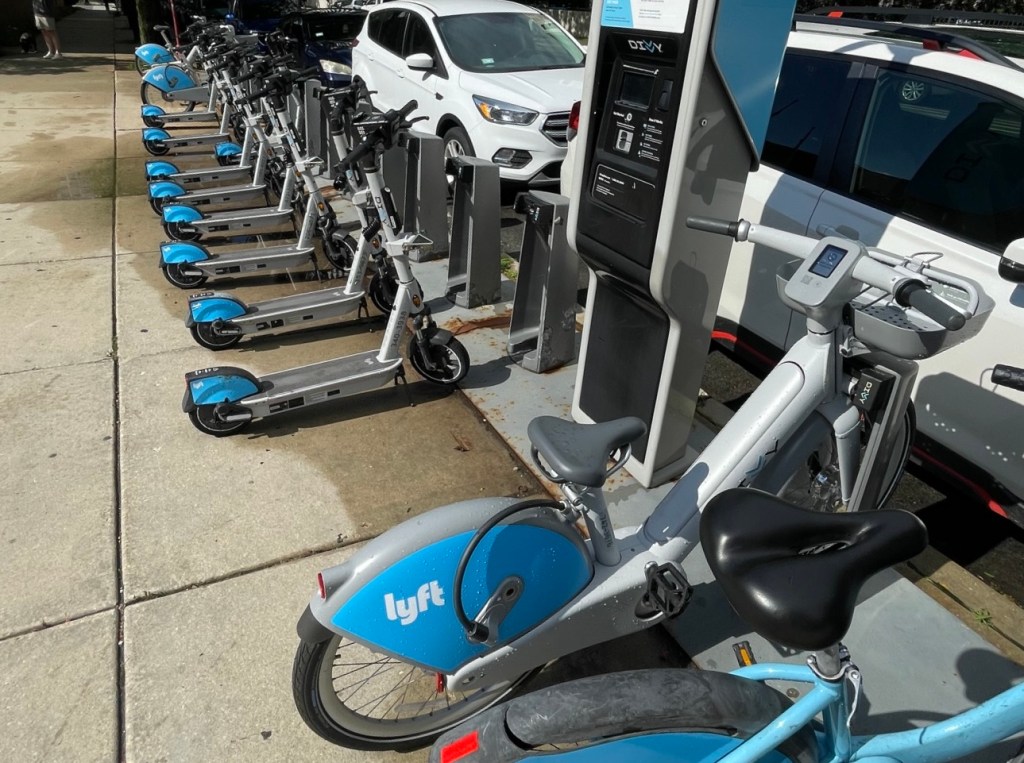
Since cities where bicycle use is mainstream also have significantly lower rates of helmet use than those where it isn’t, I also noted how many cyclists on Dearborn were wearing helmets in order to get a snapshot of this facet of Chicago’s current bicycle culture. 60 percent of all riders were wearing helmets. 58 percent of men wore helmets, but 68 percent of women were wearing them. Notably, some of the Divvy riders I observed had their own helmets, which suggests they might be annual members doing their daily commute, rather than 24-hour pass holders.
Speaking of Divvy riders, Divvy bikes accounted for seven percent of all the bikes I saw. The Divvy gender split was 28 percent women and 72 percent men. The highest peak in Divvy ridership was from 8:08 to 8:23. The chart below gives the number of riders during 15-minute increments. I started counting at 8:08 a.m.
Table 1: Cyclists by time, gender, and direction
| Bikes | Divvy Bikes | |||||||
| Direction: | South | S | North | N | South | S | North | N |
| Time | Male | Female | Male | Female | Male | Female | Male | Female |
| 8:08-8:23 | 29 | 17 | 8 | 1 | 4 | 1 | 2 | 2 |
| 8:23-8:38 | 28 | 21 | 14 | 5 | 2 | 0 | 0 | 1 |
| 8:38-8:53 | 27 | 20 | 11 | 9 | 0 | 1 | 1 | 1 |
| 8:53-9:08 | 29 | 17 | 8 | 1 | 2 | 0 | 1 | 0 |
| 9:08-9:23 | 14 | 4 | 10 | 1 | 0 | 2 | 2 | 0 |
| 9:23-9:38 | 16 | 5 | 8 | 1 | 2 | 0 | 0 | 0 |
| 9:38-9:53 | 11 | 2 | 15 | 5 | 0 | 0 | 1 | 0 |
| 9:53-10:08 | 10 | 4 | 7 | 2 | 1 | 0 | 3 | 0 |
| TOTAL= 389 |

While the Dearborn lanes allow bike travel in both directions, Washington is one-way eastbound. 100 percent of the southbound cyclists I observed turning left onto Washington used the green left-turn box designed for this purpose. This shows that cyclists are finding the left-turn box to be useful, suggesting that these boxes should be installed elsewhere in the city. Presumably, most cyclists in Chicago, and elsewhere in the U.S., turn left like a car, that is from the left-turn lane. Although some do choose to make a box turn (crossing to the far side of the intersection, turning ninety degress, waiting for the green and then crossing again), they are in the minority.
Because the left-turning cyclists at Washington/Dearborn used the turn box, they voted with their feet in favor of the new facility. This is not to say that some would rather turn without a designated place for bicycles, but it appeared to increase the comfort level of those choosing to use it, which is one of the goals of building bicycle facilities in the first place.

The vast majority of bicyclists chose to ride in the protected lanes. Only two percent rode in the travel lanes. I didn’t witness any conflicts between cyclists riding in the travel lanes and vehicles.
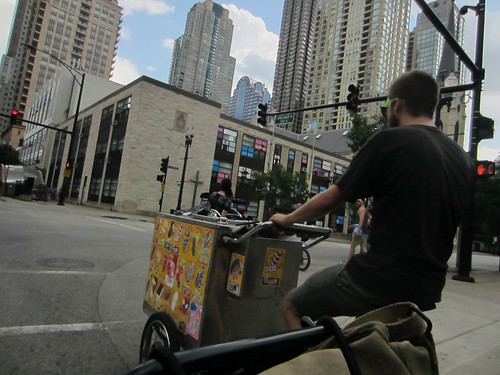
Although I noticed a wide variety of bicycle styles, ranging from road to mountain bikes, the vast majority featured “standard” two-wheel frame designs. I did see one cargo bike, two adult cyclists (one female and one male) carrying kids in rear child seats, two cyclists (also one female and one male) with empty child seats, and four folding bikes.
30 percent of cyclists I observed were carrying things, including U-locks, on their bikes. Most used panniers, some strapped objects on the top of rear racks, a few used front baskets, and others had U-locks attached to their bike frames or dangling from the handlebars. Not counting U-locks would have made the cargo count much lower.
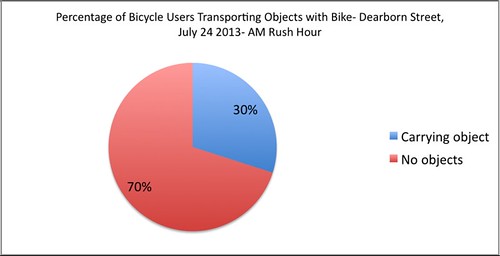
Some of the 70 percent of people not carrying anything on their bicycles might have done so if their bikes had racks, panniers, and/or baskets, since many of their bikes did not already have these accessories. To further encourage the use of bikes for transportation, we need to promote bikes for all kinds of trips, not just riding to work. Shopping by bike or picking up kids can be done just as easily via bike as commuting.
Of course you could carry things in a bag on your back, but it’s easier to carry objects or children on a properly accessorized bike, or one that’s specifically designed for hauling cargo or passengers. 28 percent of all families in Copenhagen own a cargo bike. As more Chicagoans start using bikes for utilitarian trips, it’s likely we’ll start seeing more cargo bikes here as well.
Across Europe, more and more people are using bicycles for utilitarian purposes, such as package delivery and food carts. As everyday cycling becomes more popular here, bike innovations will mushroom to encompass more services, which will in turn lead more people to replace car trips with bike trips, in a sort of virtuous cycle.
In addition to monthly and quarterly bike counts, there is much more that the Chicago Department of Transportation could do to understand current bicyclists’ patterns, tendencies, and behaviors. For example, the Copenhagenize study I referenced earlier shows that while cyclists tend to be portrayed in a negative light, a review of 12 hours of film footage from an intersection outside the company’s office window showed that 93 percent of Copenhagen cyclists obeyed all traffic rules while moving through the intersection. Six percent broke minor infractions, such as stopping for a red light in front of the stop bar or turning right on red, and one percent broke major traffic rules, such as running red lights.
Standard CDOT traffic counts that simply provide basic information, like the number of cyclists and their apparent gender, are certainly important, but the more detailed the info we are able to collect, the better the sense we’ll get of the big picture.

Streetsblog has migrated to a new comment system. New commenters can register directly in the comments section of any article. Returning commenters: your previous comments and display name have been preserved, but you'll need to reclaim your account by clicking "Forgot your password?" on the sign-in form, entering your email, and following the verification link to set a new password — this is required because passwords could not be carried over during the migration. For questions, contact tips@streetsblog.org.