Active Trans’ Bus Report Cards Highlight the Need for More Time-Saving Features
With a municipal election looming on February 26 (and don’t forget to vote in Tuesday’s mid-term election), there has been increased attention on the state of bus service in Chicago and potential solutions. Since 2012, CTA bus ridership has decreased by 21 percent, largely due to increased traffic and the rise of ride-hailing. Mayor Rahm Emanuel recently announced $5 million in funding to speed up buses on four of the city’s busiest routes.
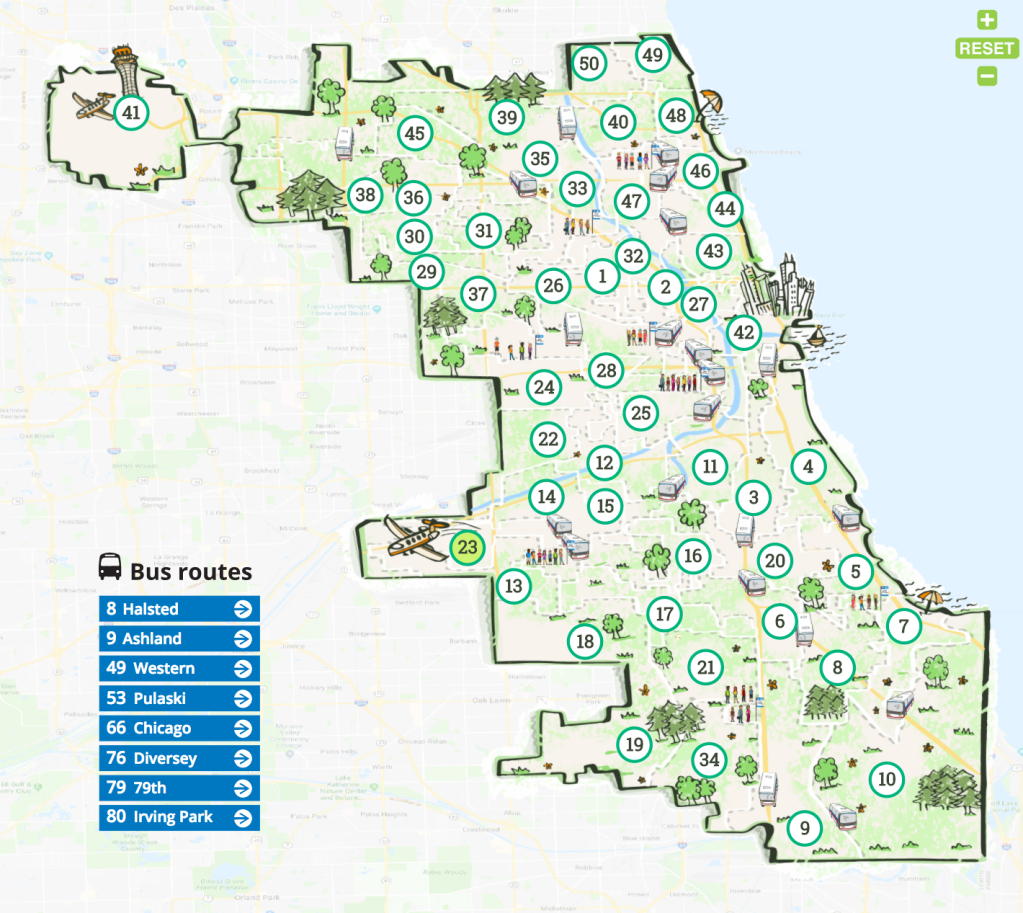
The Active Transportation Alliance recently released their Chicago Bus Friendly Streets Report Cards, which rates the quality of bus service across the city by ward and offer potential solutions to shortfalls. Eight high-ridership routes throughout the city were also graded.
ATA used data pulled using CTA’s Bus Tracker API for the month of May 2018. All trips were analyzed between 6 a.m. and 6 p.m. ATA used speed, bus bunching, and typical wait time to analyze the efficiency and reliability of buses.
In order to determine grades, ATA used goals as benchmarks for bus routes. In order to receive an A, buses had to go at a speed greater than 13 mph, bus bunching had to be less than 5 percent at high-frequency routes, and wait time had to be less than 2 minutes (see graph below for more details on grading scale).
Speed was calculated using the average distance (meters) and average time travel (seconds) for every stop by route from 6 a.m. to 6 p.m. Bunching is defined as the percentage of key route buses, as defined by the CTA’s Key Route service standards, that arrive at less than 25 percent of the scheduled interval behind the previous bus. Typical wait time is defined as how many minutes people are waiting at bus stops within in the ward beyond what the schedule states (for more information on methodology, go to the Active Trans website).
After analyzing service in all 50 wards, ATA assigned grades to each ward. They mostly gave out Cs and Ds were given out, with one A, and sadly, a few Fs. I picked a few wards and routes throughout the city and took a closer look at a passing and failing grades.
Wards
19th Ward: The only A given out was to the 19th Ward, which has eight bus routes and a relatively low 2,755 weekday rides. The average speed of buses in the ward was 13.3 mph. Only about 1.9 percent of buses bunched. Typical wait time ranged from 3.1-4 minutes on three routes.
10th Ward: With 11 bus routes and 7,106 total weekday routes, the 10th Ward received a B grade. The average speed of buses in the ward was 12.0 mph. About 5.3 percent of buses bunched. Typical wait time ranged from 2.7 min-3.8 minutes on three routes.
45th Ward: With 17 bus routes and 17,315 total weekday routes, the 45th Ward was given a C. The average speed of buses in the ward was 9.3 mph. About 8.2 percent of buses bunched. Typical wait time ranged from 4.1-9.2 minutes on three routes. The 53 bus was one of the slower buses in the ward, with an average of 6.5 mph. This came as no surprise to me, because I have way too many memories of being on a Pulaski bus crawling along at a snail’s pace.
35th Ward: It wasn’t hard to find several wards with Ds, but I settled on taking a look at the 35th Ward as my family lives in the ward. There are currently 11 bus routes in the ward with 16,221 weekday rides. The average speed of buses in the ward was 7.5 mph. About 12.1 percent of buses bunched. Typical wait time ranged from 1.5-2.1 minutes. While wait time in the 35th Ward was rather low, the average speed of buses and the high percentage of buses bunching were central reasons for its grade. Unsurprisingly, the 77 Belmont bus and 82 Kimball bus were the bus routes with the highest prevalence of bunching. Anyone who takes those buses (as I used to every day) knows this comes at no surprise.
2nd Ward: It’s ironic that a ward that contains some of Chicago’s wealthiest neighborhoods, including parts of Streeterville, the Gold Coast, Lincoln Park, and Ukrainian Village, would receive an F, but seems that affluence doesn’t always correlate with good bus service. The 2nd ward currently has 26 bus routes and 17,496 weekday rides. The average speed of buses in the ward was 6.4 mph. About 14.8 percent of buses bunched. Typical wait time ranged from 5-15.1 minutes. I would hate to be on the receiving end of that 15 min wait time.
Routes
49 Western: I chose Western because I use it fairly often to go to the North Side from my home on the Southwest Side and it’s one of the central thoroughfares of our city. This bus route got a D. I was surprised to see the grade because I’m generally happy with the service, but I typically don’t take it during rush hour, which I’m sure makes a big difference. The average speed of the #49 bus was 9.9 mph. About 13.2 percent of buses bunched. Most bunching on this route happened in the 32nd ward, which encompasses parts of Logan Square, Wicker Park, and Bucktown. I can attest to that being the parts of the route that are slower on my commute.
8 Halsted; Another bus I use fairly often is the #8. This bus route got a D. The average speed of the bus is 8.6 mph. The slowest segment is downtown in the 42nd Ward. About 10.8% of buses bunched. Most bunching on this route happened in the 25th Ward, which encompasses part of University Village, Greektown, Pilsen, and Chinatown. Given the congestion in this area (and being near the expressway), this isn’t too surprising.
Some solutions Active Trans proposed for poor bus service included adding more bus lanes with effective and equitable enforcement, speeding up boarding with tap and go with payment at all doors, and giving buses priority at traffic lights. The latter strategy already exists along the downtown Loop Link corridor, where CTA buses get a special signal to proceed through intersections before other traffic gets a green.
I enjoyed reading through the bus report cards (yes, all 58 of them.) They offer us helpful metrics that can be used for advancing the conversation about improving service. As I read through the routes, I thought of all the bus lines I’ve used throughout my life here. Many issues came to mind, such as the way bus frequency is tied to quality service.
I thought about this particularly when looking at the report card for the 10th Ward on the Southeast Side. The #30 bus had an average wait time of 2.7 min on that route, which is rather low. When I taught a program in the South Chicago neighborhood a few years ago, my students would take the #30. While it usually came on time (hence, the low wait time), the problem was that it only ran twice an hour. My facilitator and I would often let the students leave 10-15 minutes early to make sure they would be able to catch the bus, because if they missed it they’d be stuck waiting almost 30 minutes. Stories like this illuminate how the statistics in the Active Trans reports translate into real-life transit inequities.
As you read through the report cards, you may think about the CTA bus routes you’ve ridden in the past and and how your experiences are reflected in the numbers. Check out the full set of bus report cards here.
![]()
Did you appreciate this post? Consider making a donation through our PublicGood site.

Streetsblog has migrated to a new comment system. New commenters can register directly in the comments section of any article. Returning commenters: your previous comments and display name have been preserved, but you'll need to reclaim your account by clicking "Forgot your password?" on the sign-in form, entering your email, and following the verification link to set a new password — this is required because passwords could not be carried over during the migration. For questions, contact tips@streetsblog.org.