Divvy Releases Trove of Bike-Share Trip Data
Last week CDOT released data for all Divvy trips taken by members and 24-hour pass holders in 2013, and the agency is looking for the public's help in uncovering any patterns. The data includes the station where the trip began, the station where it ended, start time, end time, and whether the user had a membership or 24-hour pass.
If the user had a membership, their gender -- indicated on the website when they signed up for a membership -- and birth year were included for basic demographics. The data sheds light on where people are using the new transit system and how often. During the 187 days of service in 2013, users made 759,788 trips.
Immediately after the release, Chicago Spectrum, an LGBT-focused news site, published a simple graph that shows women accounted for only 21 percent of trips by yearly members. As Divvy Deputy Manager Elliot Greenberger described at last week's Open Gov Hack Night event, women comprise 31 percent of the yearly members. Nationally, women make up an estimated 43 percent of bike-share users. I'll be investigating why Chicago women are using their memberships less than men in a future post.
To highlight more insights embedded in the data, and to help people visualize it, Divvy is giving away some prizes in a "data challenge." The company is asking for "infographics, maps, images, animations, or websites" that help illustrate usage patterns. Entries are due March 11.
Winning entries in the five categories will be displayed at 1871, the tech startup center at the Merchandise Mart that hosts Hack Night. If you're interested in submitting a project, review the data challenge rules and get acquainted with the data on the Bike Sharing Data website.
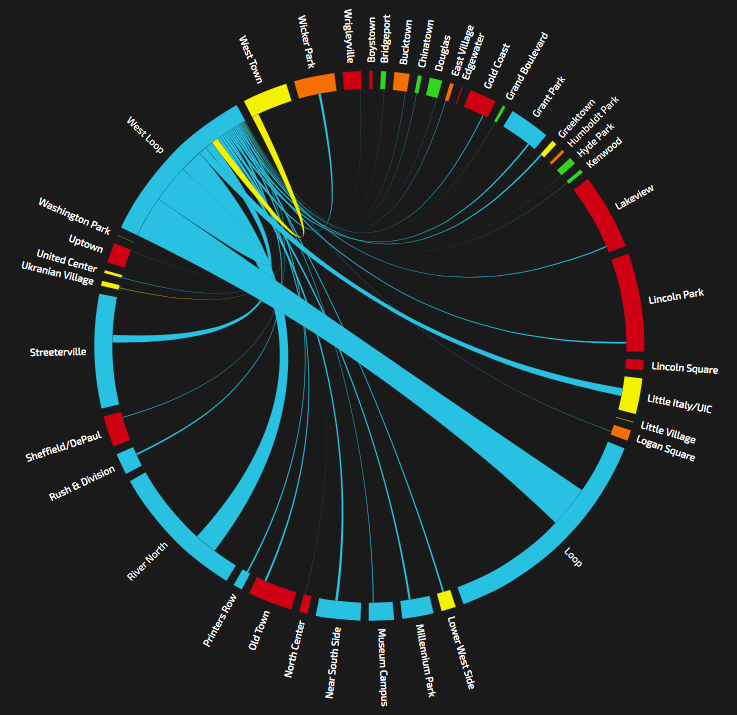
Shaun Jacobsen offered the above preview of his submission, Divvy Spokes, which shows the trip flows between neighborhoods. When it's finished, users will be able to click on a neighborhood to emphasize the trip flows to and from that neighborhood.
Here are some other interesting statistics that jumped out in my initial review:
- 24-hour pass holders made 47 percent of total trips, but for longer durations than annual members, incurring more overage fees.
- The average trip duration for 24-hour pass holders was just over 30 minutes while for members it was only 12 minutes.
- The average trip distance for 24-hour pass holders was 1.8 miles while for members it was 1.6 miles.
- When it comes to greater-than-average trip distances, compared to members, 24-hour pass users made 25 percent more trips of two miles or longer.
- Only 29.2 percent of trips by members and casual users exceeded two miles and only 5.8 percent of trips exceeded four miles.
Stay in touch
Sign up for our free newsletter
More from Streetsblog Chicago
Johnson appoints one West Side pastor to CTA board, then nominates another West Side pastor for RTA board
Supporters argue that, despite his lack of transit expertise, Ira Acree’s social justice experience and political connections could be an asset for the RTA board.

Today’s Headlines for Thursday, April 26


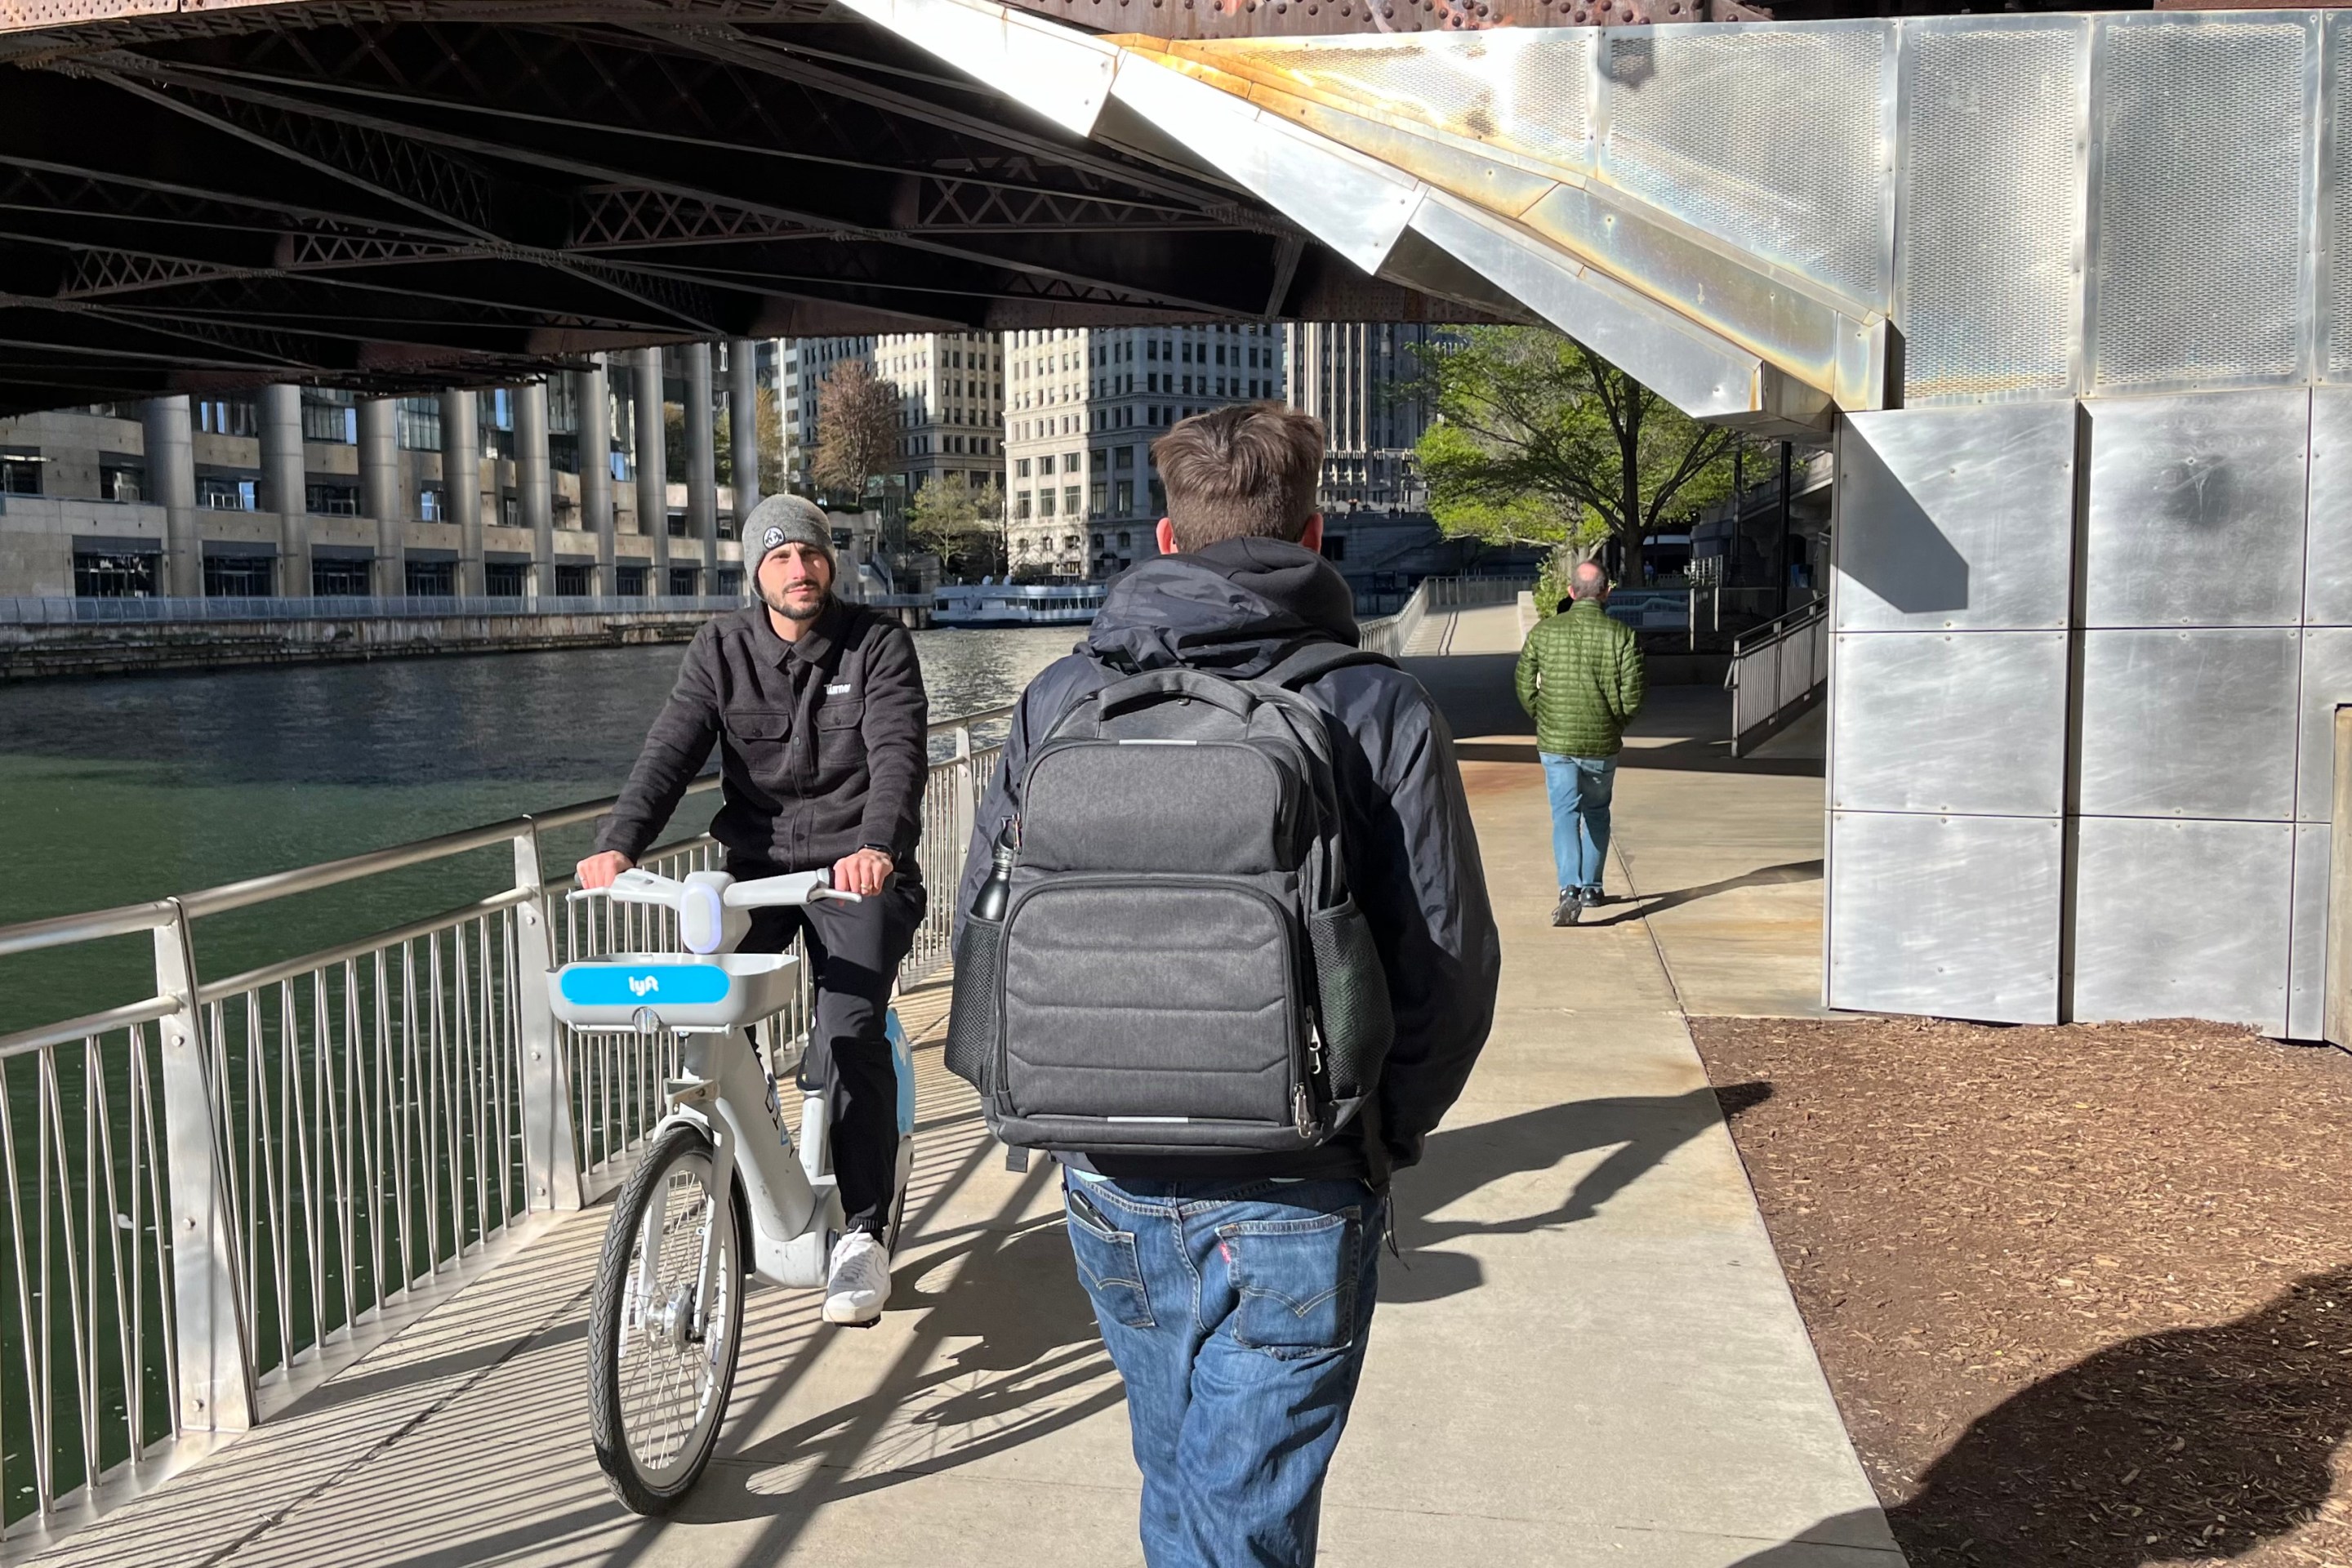
The de-facto ban on riverwalk biking is back. What should we do about it?
In the short term, new signage is needed to designate legal areas for cycling on the path. In the long term CDOT should build the proposed Wacker Drive protected bike lane.