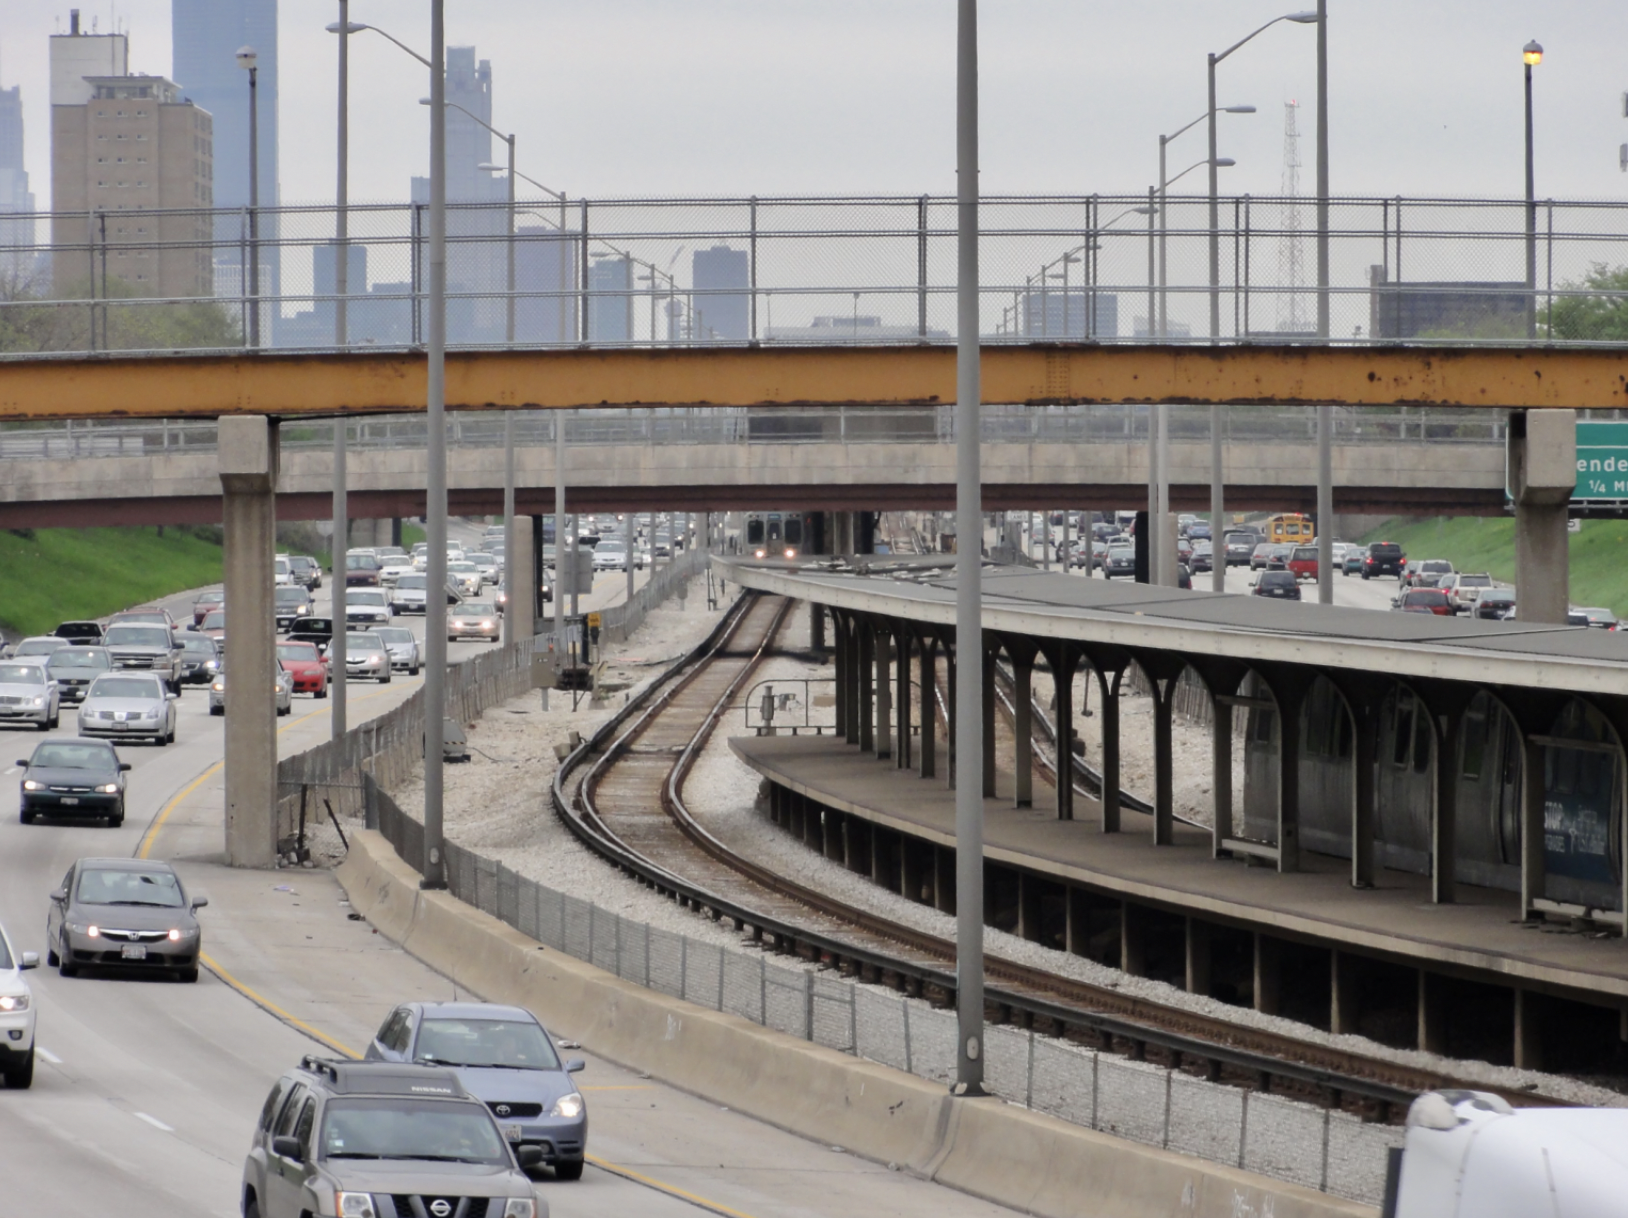
Accessible and affordable transportation is a huge quality of life issue. Transportation connects people to jobs, education, social opportunities, and social services. Mobility is having quality transportation options. The Chicago Metropolitan Agency for Planning recently released the report "Improving equity in transportation fees, fines, and fares." CMAP looked at the ways in which these costs impact residents with low-incomes, and policy changes that can increase equity.
Before diving into the report, it’s helpful to know which fees, fines, and fares were analyzed:
- Motor vehicle registration
- Fuel tax and road use charges
- Tolling
- Transit fares
- Parking
- Traffic and parking fines
- Ride-hail fees
In addition to the costs mentioned above, it’s helpful to give context. Illinois’ tax system is regressive in that those with the lowest income pay a higher share of their income than higher-income residents. Illinois taxpayers in the lowest 20 percent of incomes pay 14 percent of their income in taxes – while those in the top 5 percent of incomes pay less than 10 percent in taxes. In the context of transportation, low-income residents spend 16 percent of their income on transportation costs compared to high-income residents who spend 6 percent of their income on transportation.
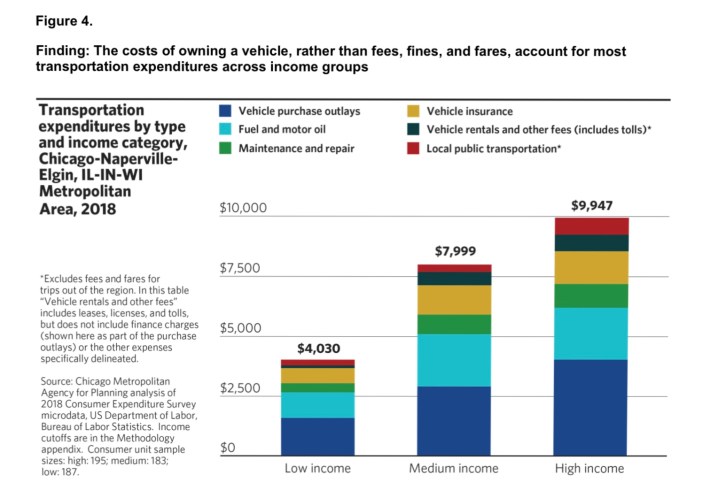
Let's look at driving-associated fees and transit fares and their equity impacts first. Unsurprisingly, researchers concluded that driving is the most expensive form of transportation not so much due to fuel taxes or vehicle registration, but the cost of owning and maintaining a vehicle. Due to the lack of quality alternatives to driving, many lower-income residents are forced to own a car in order to access work, education, and services. Increasing the number of Chicagoland residents who have access to quality public transportation is a CMAP recommendation for lowering transportation costs and improving equity. For those who still need to drive, there are a number of recommendations:
- Expand reduced registration fees for all low-income residents
- Base vehicle registration fees on vehicle value
- Provide cash options for parking fees
- Offer reduced transaction fees for short-term parking
- Develop lower-cost alternatives to IPASS transponders
- Adopt income-based fines or waivers
- Report and analyze equity impacts of ticketing
- Offer alternatives to fines
- End employment restrictions for residents who have unpaid fines
Expanding on the subject of driving-based fines and fees, let's look at traffic and parking violation fines. These fines are assessed without regard to income or ability to pay, which leads to lower-income people paying a larger share of their income than higher-income people. Lower-income residents also have a limited capacity to pay off fines in full and greater difficulty in using payment plans that require a down payment. Court fees, fines and costs collectively known as assessment may be levied in addition to the traffic violation fine, which can further increase the disproportionate burden for motorists with low income.
The financial burden of fines is especially borne by Black and Latinx residents in the region, who are disproportionately low-income. CMAP analyzed over 1.6 million traffic stops in their region and found 60 percent of traffic stops were for moving violations, which includes speeding, traffic signal, and lane violations, among others. Data analysis found that traffic stops resulted in a motorist receiving a citation 31 percent of the time – with the majority of citations for moving violations. Speeding was the most common reason for a stop in a moving violation citation, although speeding was more likely to lead to a citation and other moving violations.
Black drivers were more likely to be stopped but they were less likely to receive a citation once stopped, receiving a citation in 22.8 percent of stops, compared to roughly 35 percent of stops for all other racial and ethnic groups. However, motorists identified as Black are most likely to receive citations on a per capita basis, receiving 81 citations per 1,000 Black residents in the region compared to an overall rate of 60 citations per 1,000 residents overall.
On the subject of parking ticket fines, CMAP cited a ProPublica investigation that found eight of the 10 ZIP codes in Chicago with the most accumulated ticket debt per adult are majority-Black and highlighted how unpaid parking tickets can quickly spiral into personal bankruptcy. According to the report’s authors, more data is needed to fully understand how parking fines are distributed across drivers of different income levels in municipalities in other parts of northeastern Illinois.
Lastly, let's look at some of CMAP’s insights on transit fares and their equity impacts. All of the local transit agencies price their fares differently. Additionally, transit fares may vary among riders taking the same trip. CMAP looked at the following elements that may change the cost of a transit trip:
- Distance travelled
- Method of payment
- Type of fare purchased such as single-use ticket or unlimited-ride pass or reduced-fare permit versus full fare
- Number of transfers taken and service providers used
The report states that, “transit fares are intended to be somewhat horizontally equitable but they are not vertically equitable, as they constitute a higher percentage of total income for riders with low income.” Assessing vertical equity of transit fares collected in the Chicago region requires an understanding of who is writing transit and therefore who incurs the cost of service.
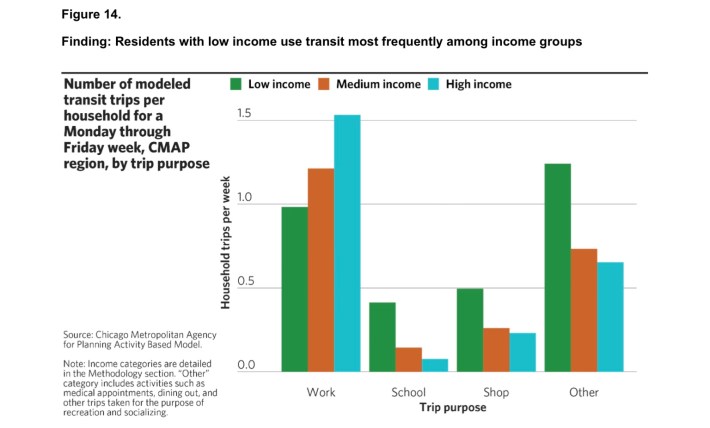
Data generated from an "Activity-Based Model" shows that low-income households used transit more frequently than middle-class and affluent households. “Households with low income average 3.1 transit trips on an average Monday through Friday week, while households with middle and high income average 2.6 and 2.5 transit trips, respectively, the report stated.”
The Activity-Based Model looks at socioeconomic determinants of travel choices and evaluates modern transportation solutions. The ABM seeks to represent the choices made by individual travelers and generates a schedule of daily activities for members of every household in the region, and then transforms that information into sequences of trips that occur throughout the day.
Middle-class and wealthier households are more likely to take transit to commute to work than for any other purposes. For these households, commute trips compromise 52 and 61 percent of our household transit trips, respectively, while commute trips comprised 31 percent of transit trips for households with low income.
On the other hand, households with low income are more likely to take transit for all other types of trips such as shopping, traveling to school, and accessing other social and recreational destinations. A household with low income in the Chicago region takes 29 percent more of these trips on transit than a household with middle income and 44 percent more than a household with high income.
The report authors stated that this is due in part to a higher reliance on transit as a primary mode of transportation given that low income households own vehicles at lower rates than other households. “It also underscores the importance of ensuring that transit remains affordable for these residents to live, work, and travel the region as they need,” the report states.
When it comes to transit fares, CMAP looked at the cost of a year of monthly transit passes for CTA, Pace, and Metra; how payment methods can impact fare cost, and the impact of transfer costs. Unsurprisingly, the cost of a yearly transit pass represents a significant slice of income for many low-income transit riders.
Having a Ventra card can provide cost savings on fares. Riders can reduce their base fare payments on CTA and Pace regular fixed routes if they use a Ventra card to pay their fare instead of cash. While riders can add cash to their Ventra card at CTA train stations, Pace bus terminals with a Ventra machine, qualified retailers, and over the phone, “the Ventra card is most accessible to riders who have either a debit or credit card and access to the internet, whether on a computer or a smartphone.” If a rider’s trip requires numerous transfers, Ventra can provide savings given the ability to track the transfers. But if a rider needs to use two buses for a trip and doesn’t have Ventra, they pay significantly more.
Cash fare on CTA buses is $2.25. For a person paying cash for a trip involving two different buses, the total is $4.50 versus $2.50 when paying full fare via Ventra ($2.25 for the initial bus boarding and .25 for the transfer). CMAP found that the barrier most likely to prevent a rider — particularly bus riders — from using Ventra is being under- or unbanked. CMAP recommends increased access to Ventra through direct support or recruiting community sponsorships.
There's a lot more great analysis and recommendations in the report. Access the report on CMAP's website.
Read More:
Stay in touch
Sign up for our free newsletter
More from Streetsblog Chicago
City announces $2M federal grant to address harms caused by I-290 by improving walk/bike/transit access
The Mayor's Office says the money will fund "improvements for people walking and bicycling on existing streets and paths surrounding and crossing the corridor."
Today’s headlines for Tuesday, April 16

CDOT reveals that it spent nearly $700K to install concrete protection on Doty bike lanes, and then remove it
Some of the former Doty bikeway curb protection was relocated to CDOT projects at Broadway/Aldine and on Wrightwood.
TLC in the IMD: the Illinois Medical District Commission releases bike and pedestrian safety plan
Five proposed projects would improve walking and biking safety - and beautify - the IMD.